Curated OER
Ratios, Mars and the Internet
Students calculate real ratios that exist between the planets Earth and Mars. After a lecture/demo, students use worksheets and access Internet sites to do their calculations.
Curated OER
How Fast Is Your Car?
Eighth graders discover the relationship between speed, distance, and time. They calculate speed and represent their data graphically. They, in groups, design a ramp for their matchbox car. The goal is to see who's ramp produces the...
Curated OER
Baseball Relationships - Using Scatter Plots
Students use graphing calculators to create scatter plots of given baseball data. They also determine percentages and ratios, slope, y-intercepts, etc. all using baseball data and statistics.
Curated OER
Go Car, Go!
Students design and build their own car. In this physics lesson, students collect data to determine the speed of the car. They plot the data on the graph analyze the relationship between variables.
Curated OER
A Beating Heart
Students collect and analyze data using percent difference. In this algebra activity, students relate the concepts of algebra to cardiac physiology.
Curated OER
Making Change
Second graders explore how to incorporate a new type of technology, the cash register and/or a calculator, as a motivational tool for solving real life problems. They practice estimating money and counting back change from $20.00.
Curated OER
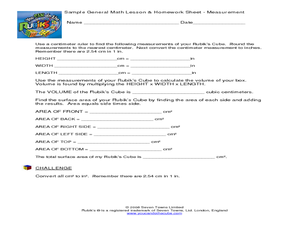
Measurement
Learners measure angles, perimeter, area and volume. In this geometry lesson, students define different ways to measure and solve for the perimeter, area and volume of geometric shapes. They analyze and process information to help them...
Curated OER
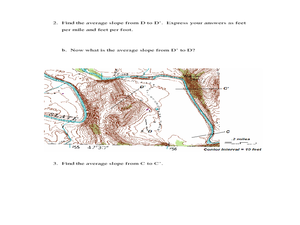
Slope and Topographic Maps
Learners investigate slopes as they study topographic maps. In this algebra lesson, students discuss and apply the concept of slopes to graphing and analyzing data.
Curated OER
T-Shirt Lettering
Students determine the cost of a t-shirt using a variety of mathematical operations to solve problems. Then they use a spreadsheet to calculate the cost of lettering a t-shirt and display this information in a graph.
Curated OER
Surface to Volume Ratios
High schoolers measure the rate of diffusion and to calculate the surface area to volume ratios of varying cell sizes. The lesson is very clearly organized with a useful student worksheet provided. They perform a lab experiment which is...
Curated OER
Infusing Equity Vs Gender into the Classroom
Students explore the effect of gender bias in the classroom. In this statistics lesson plan, students discuss the effects of stereotyping, discrimination, and gender bias in the classroom. They collect data on different work places...
Curated OER
How Far Did They Go?
Students create a map. In this direction and distance lesson, students come up with familiar places in the community and calculate the distances from these places to the school. Students create a map that displays these places and their...
Curated OER
RIP M&M's
Students solve theoretical probability problems. In this algebra instructional activity, students apply the concept of probabilities to solving real life scenarios. They collect data and graph it using experimental probability.
Curated OER
Giving'Em The Business
Students work in groups of 4-5 to form a business, create, market & sell their product, and track their expenses and profits. They experience the roles of producer, distributor, and consumer of goods. They collect, organize and...
Curated OER
Investigating Area Using Tangrams
Tenth graders connect the history of geometry to problem solving. In this geometry lesson, 10th graders investigate polygons through hands on manipulatives and solve problems relating to parallelograms and triangles. They calculate the...
Curated OER
Three, Two, One, Go!
Students work in teams conducting an experiment that demonstrates why the height of an inclined plane affects the speed at which an object travels. They record data on a chart and calculate speed to reveal the results of three trials at...
Curated OER
The Amazing Heart
Students examine human blood flow by comparing the pulse of athletes. In this human body lesson, students discover the equation for finding the cardiac output from a human heart. Students identify heart rates of accomplished...
Curated OER
Discovering The Power Of Sunlight
Students participate in a lesson that looks at the potential for energy from sunlight. Students conduct research from a variety of resources and construct an object that is used to measure the energy of sunlight and calculate the amounts...
Curated OER
Introduction to Work
Fifth graders define work, force, and energy and calculate work done using a simple formula. They observe the teacher using an Equi-beam and identify the fulcrum, calculate different work problems, and participate in a class discussion.
Curated OER
Surface Friction and Wear Characteristics of Common Materials
Students identify the factors affecting friction. In this physics lesson, students construct their own rocket car and race them. They graph the average speeds and discuss how lubricants affect friction between rubbing surfaces.
Curated OER
Automobile-Accident Reconstruction
Students investigate an accident and relate it to math. In this trigonometry lesson, students measure the accident scene, the friction produced, and the speed from the skid marks. They create a poster of their findings.
Curated OER
A Picture's Worth a Thousand Words
Students analyze the numbers of male vs female administrators and teachers from their school. In this gender equality lesson plan, students use school yearbooks from the 1950's threw present to count how many male vs. female teachers,...
Curated OER
Global Warming Statistics
Students research real-time and historic temperature data of U.S. and world locations, and analyze the data using mean, median, and mode averages. They graph the data and draw conclusions by analyzing the data. A spreadsheet is used to...
Curated OER
Graphing Data
Students graph lines in a coordinate plane. In this geometry instructional activity, students graph lines on a coordinate plane, and identify the slope. They calculate the volume, area and perimeters of the shapes created on a coordinate...


