Bowland
Fashionista
So trendy! Show your class how to identify trends in sales patterns using mathematics. Scholars use a software simulation to collect data on age groups, price, and sales at a fashion store. This data allows individuals to determine the...
Curated OER
Statistical Analysis
In this statistics worksheet, students analyze the data provided in order to determine the null hypothesis, an alternate hypothesis, and the significant difference between the groups. The one page worksheet contains three scenarios...
Rice University
Introductory Statistics
Statistically speaking, the content covers several grades. Featuring all of the statistics typically covered in a college-level Statistics course, the expansive content spans from sixth grade on up to high school. Material...
Curated OER
How to Graph in Excel
Fourth graders construct data graphs on the Microsoft Excel program. In this statistics lesson, 4th graders formulate questions and collect data. Students represent their results by using Excel.
Curated OER
Excel for Beginners
In this Excel lesson, students set a formula to check their homework. Students also use clipart, work in groups, and learn to use the tools in the drop-down list.
Curated OER
McCadam's Quarterly Report
Fourth graders problem solve a problem from a local business using data, generating graphs, and draw conclusions. They submit their findings in a business letter format with feed back from a company's plant manager.
Curated OER
Ice Cream
Learners explore the concepts of mean, median, mode, and range as they elicit data about people's favorite flavor of ice cream. A practical application of the data obtained offers an extension to the lesson plan.
Kenan Fellows
Lego Thinking and Building
Run a simulated airplane manufacturing plant with your pupils as the builders! Learners build Lego airplane models and collect data on the rate of production, comparing the number produced to the number defective. Using linear...
Curated OER
IT IS ABOUT SUPPLY AND DEMAND.
Students learn that the price of an item is defined by its supply and demand. In this lesson students graph the relationship between demand and supply of various products, students also consider hidden costs.
Curated OER
Beginning Graphs in MS Excel
Students practice creating graphs in Microsoft Excel. In this technology lesson, students conduct a random survey and collect data. Students use the Microsoft Excel program to create a bar graph of the data.
Curated OER
RISKY BUSINESS--OR NOT!
Students learn about the importance and risk that stocks carry within a business. In this financial management lesson plan, students use role play and case scenario situations to decide what stocks are best for given companies. Based on...
National Research Center for Career and Technical Education
Business Management and Administration: Compound Interest - A Millionaire's Best Friend
Many math concepts are covered through this resource: percentages, decimals, ratios, exponential functions, graphing, rounding, order of operations, estimation, and solving equations. Colorful worksheets and a link to a Google search for...
Curated OER
A Computer Model For a Recycling Center
Learners develop a working model computer program of a recycling center addressing the material management, work schedules and business finances of running the recycling center.
Curated OER
Create a Budget
Young scholars develop a budget spreadsheet to manage finances for their business. In this finance instructional activity, students use a spreadsheet program to create a budget with credit and debit columns. There are...
Curated OER
Toy Planet
Students design a toy store, supply it with merchandise (on paper) and create advertisements. They also manage the store's debits and credits by using a spreadsheet. They consider how to promote the sale of their merchandise.
Curated OER
Ladybugs in the Garden
Fifth graders estimate the size a population (ecosystems) Students make a chart from information collected then create a graph (line or bar) from this information. Students do a lesson where they observed, examine, and record data...
Curated OER
Dental Impressions
What an impressive task it is to make dental impressions! Pupils learn how dentists use proportional reasoning, unit conversions, and systems of equations to estimate the materials needed to make stone models of dental impressions....
Curated OER
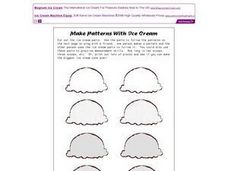
Make Patterns With Ice Cream
In this ice cream patterns learning exercise, students cut out ten scoops of ice cream and two cones. Students team up with a partner and exchange matching different patterns for the other one to model.
Curated OER
Telling Time
In this telling time learning exercise, students cut out forty-two clocks, shuffle the clocks and then put them in sequential order by telling time in fifteen minute increments starting at 1:00am.
Curated OER
Exploring Quadratic Graphs
Students solve quadratic equations using graphs. In this algebra lesson, students factor quadratic equations and graph their answer. They discuss the shape of their graph based on the function.
Curated OER
The Days of the Week
In this calendar instructional activity, students cut out 3 cards that have days of the week printed on them. Students paste them correctly on a one week calendar.
Curated OER
Gorilla Alphabet and Number Cards
For this gorilla alphabet and number cards worksheet, students color and cut apart a separate card for each upper and lower case (Zaner-Bloser) alphabet letter. Students also color the number cards from 1 to 10.


