Radford University
Can I Create a Line/Curve of Best Fit to Model Water Drainage?
Learners collect data on the amount of water left in a bottle over time. They graph the data to determine whether the scatter plot shows a curved or straight relationship. Group members then determine an equation for the curve of best...
Curated OER
Lines of Best Fit
Students explore the concept of line of best fit. In this line of best fit instructional activity, students find lines of best fit in examples about riding your bike home from school and dentistry. Students find two data points and find...
Curated OER
Lines of Best Fit
Learners determine if there is an associationm in a scatter plot of data. They analyze data through predictios, comparisons, and applications. Students calculate the line of best fit using a graphing calculator. They display data in...
Curated OER
Line of Best Fit
Students identify the line of best fit. For this statistics lesson, students collect and analyze data. They calculate the regression equations and identify the different types of correlation.
Curated OER
Line of Best Fit
Students calculate the equation of the line of best fit. For this statistics lesson, students create scatter plots and find the line of best fit going through their data. They make predictions and draw conclusions.
Curated OER
Line of Best Fit
Students explore the concept of linear regression. In this linear regression lesson, students do a Barbie bungee activity where they collect linear data. Students plot their data using a scatter plot. Students determine a line of best...
Shodor Education Foundation
Data Flyer
Fit functions to data by using an interactive app. Individuals plot a scatter plot and then fit lines of best fit and regression curves to the data. The use of an app gives learners the opportunity to try out different functions to see...
Jordan-Granite Consortium
Scatter Diagram
You aced the first test, so your score on the second one shouldn't matter, right? Young pupils first draw a best fit line on a provided scatter plot showing test scores for two different tests. They then evaluate five statements on the...
Balanced Assessment
Fit-Ness
Serve four towns with one bus route. Pupils develop a bus route that meets certain criteria to serve four towns. They determine which of the routes would best serve all of them. Individuals then hypothesize where a fifth town should be...
Curated OER
Linear Modelling of the Life Expectancy of Canadians
Middle and high schoolers explore the concept of linear modelling. In this linear modelling lesson, pupils find the line of best fit for life expectancy data of Canadians. They compare life expectancies of men and women, and find the...
Curated OER
A Sweet Drink
Students investigate reaction rates. In this seventh or eighth grade mathematics lesson, students collect, record, and analyze data regarding how the temperature of water affects the dissolving time of a sugar cube. Studetns determin...
Curated OER
Water Down the Drain
Did you know that leaky faucets waste $10 million worth of water? Conservationists perform an experiment and draw best-fit lines to explore how the US Geological Society determined this value.
Curated OER
Comparison of Two Different Gender Sports Teams - Part 3 of 3 Scatter Plots and Lines of Best Fit
Students create a scatter plot for bivariate data and find the trend line to describe the correlation for the sports teams. In this scatter plot lesson, students analyze data, make predictions,and use observations about sports data...
Curated OER
Integration: Statistics, Scatter Plots and Best-Fit Lines
In this math worksheet, learners identify the type (if any) of correlation on 6 scatter plots. They use information given on a table to create a scatter plot and identify the type of correlation. Students use the scatter plot to make...
Curated OER
Using Data Analysis to Review Linear Functions
Using either data provided or data that has been collected, young mathematicians graph linear functions to best fit their scatterplot. They also analyze their data and make predicitons based on the data. This lesson is intended as a...
Flipped Math
Correlation
Determine how close the line is to the scatter plot. Clear video instruction shows how to plot a scatter plot and find the best fit line using the linear regression function on a calculator. Pupils use the information from the calculator...
K20 LEARN
You’re The Network: Data Analysis
How do you rate? Young scholars use graphical data to analyze ratings of different television episodes. Their analyses include best-fit lines, mean, median, mode, and range.
US Department of Commerce
Educational Attainment and Marriage Age - Testing a Correlation Coefficient's Significance
Do women with college degrees get married later? Using a provided scatter plot of the percentage of women who earn bachelor's degrees and the median age at which women first get married over time, pupils conduct a linear regression...
101 Questions
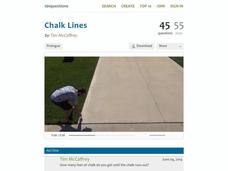
Chalk Lines
Read between the lines to find a solution. Budding mathematicians analyze a situation to solve a problem. They view a video presentation of the problem, brainstorm important information to gather, and write linear equations to find...
Curated OER
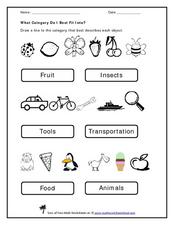
What Category do I Best Fit Into?
Use this pre-reading exercise to help learners sort familiar objects into categories. For each of these three sets, they draw a line from the object to the category in which it belongs. There are two categories for each set. If scholars...
EngageNY
Interpreting Residuals from a Line
What does an animal's gestation period have to do with its longevity? Use residuals to determine the prediction errors based upon a least-square regression line. This second lesson on residuals shows how to use residuals to create a...
Balanced Assessment
Who's Left?
If you're not right-handed, are you wrong-handed? Young statisticians calculate the percentage of left-handed people using a given data set in the assessment task. They plot data on a scatter plot and consider how the line of best fit...
Illustrative Mathematics
Lines of Symmetry for Quadrilaterals
Explore how lines of symmetry help define different categories of quadrilaterals. Looking at a square, rectangle, trapezoid, and parallelogram, young mathematicians discover that each shape has its own, unique symmetry. Encourage your...
Curated OER
Equation of a Line
In this equation of a line worksheet, 9th graders solve and complete 4 different multiple choice problems. First, they use the median fit method to determine the equation that most likely represents the line of best fit for the data...
Other popular searches
- Line of Best Fit
- Lines of Best Fit
- Math Best Fit Line
- Best Fit Linear Data
- Algebra Line of Best Fit
- Best Fit Line Worksheets
- Best Fit Linear Data"
- Correlation Best Fit Lines
- Graphing Best Fit Linear Data


