Curated OER
Box Plots
Young statisticians are introduced to box plots and quartiles. They use an activity and discussion with supplemental exercises to help them explore how data can be graphically represented.
Curated OER
Children's Museum of Houston - Pre/Post Classroom Activities - Nets
Students make three dimensional shapes with nets. In this nets lesson, students receive nets which they fold to make a three dimensional object. They predict what shape each net will make and verify it after making the net. They use the...
Curated OER
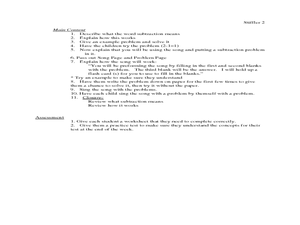
Subtracting from Ten: Using Math with Music
Young scholars explore basic math functions by singing with their classmates. In this addition and subtraction lesson, students sing the song "5 Green and Speckled Frogs"and complete a list of subtraction problems. Young scholars...
Curated OER
Graphing Linear Equations
Ninth graders develop an understanding of and the applications for linear equations and their graphical displays. They participate in a cooperative learning activity of matching a graphic display with an equation.
Curated OER
What's the Best Deal?
Students explore number sense by solving consumer math problems. In this pattern identification lesson, students analyze a list of numerical and geometric patterns while predicting the future outcome. Students utilize inference skills to...
Curated OER
Dividing by 4's
Third graders explore math functions by completing problem solving activities. In this division lesson, 3rd graders utilize the division strategies acquired earlier to divide multiple digit numbers by 4's. Students complete problems on...
Curated OER
FCAT Real World Solving Linear Equations/Systems
Pupils relate real life situation to the equations, graphs and inequalities. They model real life scenarios using matrices and draw conclusions from their data. This lesson plan is aligned with FCAT.
Curated OER
TI-89 Activities for PreCalculus and AP Calculus
Using the TI-89 calculator, high schoolers explore the statistical, graphical and symbolic capabilities of the TI-89. Students investigate topics such as solving systems of equations, finding inverse functions, summations, parametrics...
Curated OER
A Polynomial Quilt
Tenth graders create polynomial quilts. In this polynomials lesson, 10th graders use concrete models, such as construction paper, to create various shapes described. Students use the FOIL method to multiply terms and to get a square...
Curated OER
Volumes of Rectangular Prisms
Students determine the volume of a rectangular prism. They then maximize and minimize the volume given variable side lengths. Finally, they factor the volume equation to determine the side lengths.
Curated OER
Using Innovative Approaches To Explore Functions
Use student-directed resource sheets, multiple approaches, and group work instead of drill and kill.
Curated OER
Quilting with Middle School Students: Using Proportionality to Develop Quilt Designs
Learners use quilt patterns to illustrate ratios. In this fractions lesson, students color quilt patterns using given fractions and ratios of colors. A finished "quilt" is assembled from the work of the learners. This is an...
Curated OER
Get Your Numbers in Shape - TI-83
High Schoolers use the TI-83 calculator to produce a sequence, explore patterns and find a linear or quadratic equation for a given pattern. They use inductive reasoning to make conjectures about patterns. They find the Y-value of a...
Curated OER
Rise Over Run
Students define the slope of the line, find the slope between any two points on the line, and allow them to name other areas where the slope is used. They explain why the slope is defined as the rise over the run.
Curated OER
First Degree Equations
Students establish a solid competence in solving all types of equations and a solid understanding of how variables and equations can be utilitzed to solve real life problems.
Curated OER
Grade 3: Palindrome Patterns
Third graders use addition to create numbers that are palindromes and organize their results to look for patterns. They make generalizations from patterns and practice reading large numbers and addition with regrouping.
Curated OER
Graphing Systems at the Races
Learners investigate systems of equations as they use the Ti-Navigator to explore scenarios about dog races and NASCAR races. Pupils determine the winner of the race and when opponents pass each other given a speed and distance.
Curated OER
Exploring the Exponential Function
Learners collect and analyze data regarding exponential functions of the form y = abx. Young scholars explore the affects of changing parameters on the graph of the function.
Curated OER
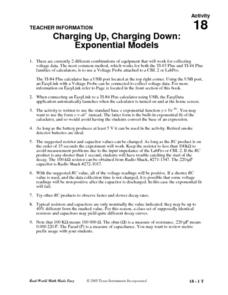
Charging Up, Charging Down
Learners collect and analyze voltage data. Then, they investigate exponential functions using the TI and a Voltage Probe and graph their data and analyze it using a table.
Curated OER
Where Should They Hold the Fundraising Party?
Pupils explore financial applications of linear functions. As they investigate the steps necessary to plan a fundraising event, learners explore minimizing cost and maximizing profits.
Curated OER
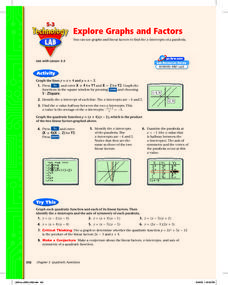
Explore Graphs and Factors
Pupils graph the factors of a quadratic as linear equations and graph the parabolic equation in factored form. Also, they investigate the relationship between the x-intercepts of the lines and the zeros of the parabola.
Curated OER
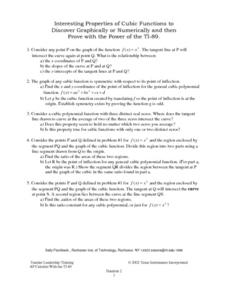
Interesting Properties of Cubic Functions to Discover Graphically or Numerically
Learners investigate the slope of a cubic function. They find the tangent line of the cubic function at point P, and discuss the relationship between point P and point Q, the point the tangent line intersects the cubic function. They...
Texas Instruments
2B or not 2B a Functions
Learners use their graphing calculators to view graphs of equations. They tell if each equations is or is not a function and are shown pre-set graphs on their graphing calculators. They use the Quick Poll feature to indicate if the graph...
Curated OER
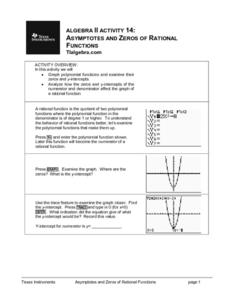
Asymptotes And Zeros of Rational Functions
Budding mathematicians graph polynomial functions and examine their zero and y-intercepts. They analyze how the zero and y-intercepts of the numerator and denominator affect the graph of a rational function. Several great additional...


