Curated OER
Patterns Everywhere!
Learners recognize and demonstrate the patterning of numbers and objects in our environment. They create a pattern using geometric shapes and find a missing number in a sequence.
Curated OER
Connecting Formulas Related to Geometric Figures
Students identify diagrams of quadrilaterals and circles by different names and classify the figures. They name the areas for each diagram and practice solving the formulas for each.
Curated OER
Exploring Transformations with Matrices
A page right out of the Holt Geometry book. Use a graphing calculator and graph paper to explore transformations with matrices.
Curated OER
Exploring Circles
High schoolers explore circles using a graphing calculator. For this circles lesson, students write the equation of a circle with a given center and radius length. High schoolers find the most appropriate model for each combination of...
Noyce Foundation
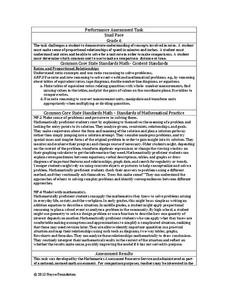
Snail Pace
Slow and steady wins the race? In the assessment task, scholars calculate the rates at which different snails travel in order to find the fastest snail. Hopefully, your class will move much more quickly in finishing the task!
Curated OER
Box Plots
Young statisticians are introduced to box plots and quartiles. They use an activity and discussion with supplemental exercises to help them explore how data can be graphically represented.
Curated OER
Design Patterns
Pupils extend and create patterns. Through a variety of activities, they discover patterns as they exist in math and their everyday lives. Students create a necklace that represents a pattern.
Curated OER
Linear and Exponential Models
Students linearize data to determine if an exponential model is suitable. In this linearizing data to determine if an exponential model is suitable lesson, students graph the residuals of sets of data that appear to have an exponential...
Curated OER
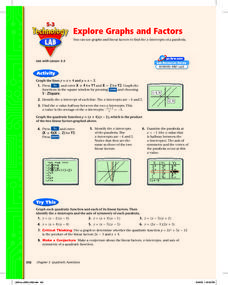
Explore Graphs and Factors
Pupils graph the factors of a quadratic as linear equations and graph the parabolic equation in factored form. Also, they investigate the relationship between the x-intercepts of the lines and the zeros of the parabola.
Curated OER
How Texas is Planning To Manage Its Water
Learners research water management strategies in Texas. They analyze projected demand for water in the year 2050, interpret graphs and tables and then discuss the data as part of a written report. They research and map the locations of...
Curated OER
Baseball Relationships - Using Scatter Plots
Students use graphing calculators to create scatter plots of given baseball data. They also determine percentages and ratios, slope, y-intercepts, etc. all using baseball data and statistics.
Curated OER
Graphing Systems at the Races
Learners investigate systems of equations as they use the Ti-Navigator to explore scenarios about dog races and NASCAR races. Pupils determine the winner of the race and when opponents pass each other given a speed and distance.
Curated OER
Slopes of Lines
Students examine a graph and relate it to the real world situation it depicts. They investigate changes in an equation and the appearance of a line. They investigate the connection between the graph of a situation and the meaning of the...
Curated OER
Logarithms For Analog Circuits
In this electric circuit worksheet, students answer a series of 16 questions about logarithms and how they are used in understanding analog circuits. This worksheet is printable and the answers are viewed on-line.
Curated OER
A Polynomial Quilt
Tenth graders create polynomial quilts. In this polynomials lesson, 10th graders use concrete models, such as construction paper, to create various shapes described. Students use the FOIL method to multiply terms and to get a square...
Curated OER
Collecting Ball Bounce Data
Learners investigate quadratic equations as they use a CBR to collect and analyze data regarding a bouncing ball. Pupils explore different methods for determining the equation of the parabolic path including quadratic regression and...
Curated OER
Writing Equations of Parabolas in Vertex Form
Pupils use their knowledge of the vertex form of a quadratic equation to graph parabolas using a graphing calculator, given a specific move to make. this lesson may be used as a review or as extra practice, in groups or individually.
Curated OER
Volumes of Rectangular Prisms
High schoolers determine the volume of a rectangular prism. They then maximize and minimize the volume given variable side lengths. Finally, they factor the volume equation to determine the side lengths.
Curated OER
Introduction to Fractals: Infinity, Self-Similarity and Recursion.
This lesson introduces students to the ideas involved in understanding fractals. They develop a sense of infinity, self-similarity and recursion and
Curated OER
Introduction to Fractals: Geometric Fractals
Learners study and observe the patterns made by the areas of the Sierpinski Triangle. Students use the computer to draw two or three iterations to discover the number patterns. Learners complete worksheets based on Geometric Fractals.
Curated OER
NEXT GENERATION SPACECRAFT-Orion
Students investigate the volume of a solid. In this calculus lesson plan, students use integration to find the volume of a solid generated by a region, the Orion crew module.
Curated OER
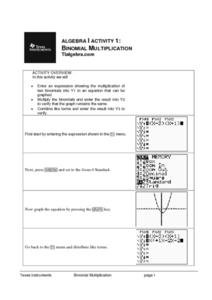
Binomial Multiplication
Learners explore binomial multiplication through the use of technology. Using a graphing calculator, you pupils enter the binomial expression into Y1, multiply the binomials and enter that result into Y2, and combine like terms and enter...
Curated OER
Rise Over Run
Students define the slope of the line, find the slope between any two points on the line, and allow them to name other areas where the slope is used. They explain why the slope is defined as the rise over the run.
Curated OER
The Mystery of the Missing Hummingbirds
Students record scientific observations in a science journal. In this season lesson, students make observations about each of the seasons and record in their journals. Students record organisms response to seasonal changes...


