Curated OER
Approximation of Pi
Young scholars explore the concept of Pi. In this Pi lesson, students measure the circumference and diameter of a circle. Young scholars record the diameter and circumference measurements from their classmates. Students...
Alabama Learning Exchange
Technology for Displaying Trigonometric Graph Behavior: Sine and Cosine
Students explore the concept of sine and cosine. In this sine and cosine instructional activity, students work in groups to graph sine and cosine functions. Students examine how coefficients in various parts of each parent...
Curated OER
TI-89 Activities for PreCalculus and AP Calculus
Using the TI-89 calculator, learners explore the statistical, graphical and symbolic capabilities of the TI-89. Students investigate topics such as solving systems of equations, finding inverse functions, summations, parametrics...
Curated OER
Discriminating Against the Zero
Students explore the concept of quadratic equations. In this quadratic equations lesson, students find the roots or zeros of quadratic equations using the quadratic formula. Students give examples of functions with 2 real,...
Curated OER
Himalayan Herds: Fractional Exponential Growth
Students solve problems by identifying exponential growth and decay and differentiating between patterns, relation and functions. In this algebra lesson, students apply concepts of exponential growth to solve problems.
Curated OER
Introduction to Tangent Lines using the TI-Nspire
Students make mathematical argument using the concept of Limit. In this algebra lesson, student calculate the instantaneous rate of change from the linear graph. They use a TI-calculator to create a visual of the graphs.
Curated OER
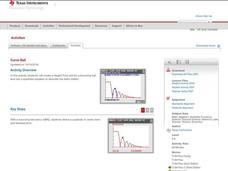
Curve Ball
Learners explore the concept of parabolas by collecting quadratic data on a bouncing ball as it is falling using a motion detector. They plot the data and determine the equation of the quadratic in vertex form, then determine the values...
Curated OER
Perimeter Pattern
High schoolers investigate perimeter patterns formed by a hexagon and a triangle. They will identify the dependent and independent variable and write a function for the relationship.
Curated OER
Exploration Sequence of Bounces
New skills are developed as students use graphing calculators and ranger technology to capture and graph the sequence of bounces a ball makes when dropped. After recording the height of four or more bounces, they use the collected data...
Curated OER
Distributive Property
Learners solve problems using distribution. In this algebra lesson, students factor equations using the distributive property. They graph their solution on a graph.
Curated OER
Using Excel To Teach Probability And Graphing
Students engage in the use of technology to investigate the mathematical concepts of probability and graphing. They use the skills of predicting an outcome to come up with reasonable possibilities. Students also practice using a...
Curated OER
Linear Equations
For this Algebra I/Algebra II worksheet, students write the equation of a line given the coordinates of two points on the line. The one page worksheet contains a combination of three multiple choice and free response...
Curated OER
Evaluation Expressions
High schoolers explore algebraic expressions in this Algebra I activity. They evaluate expressions using paper and pencil and then use the TI-83 to provide immediate reinforcements.
Curated OER
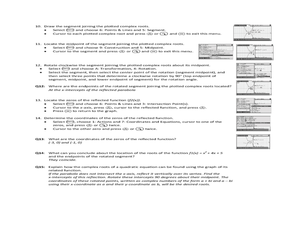
Complex Roots: A Graphical Solution
Using their Ti-Nspire to determine the solutions of parabolas, high schoolers explore the concept of complex roots. Students determine if parabolas have real or complex roots. High schoolers determine the the axis of symmetry...
Curated OER
Which Method Will You Choose? Finding Solutions to Systems of Equations.
Ninth graders investigate systems of linear equations. For this Algebra I lesson, 9th graders determine which method is the best for solving a systems: graphing, substitution, or elimination. Students choose...
Texas Instruments
Variables and Expressions
Learners solve equations by writing expressions. For this algebra lesson, students identify the different values for each variable. They use the navigator to see how to solve equations.
Texas Instruments
Data Collection for Bar Graphs
Learners study the concept of central tendency in this data collection for bar graph lesson. They collect data outside as instructed and organize it into a bar graphs, then they list in specific groups the labels that appear on the...
Curated OER
Dividing by 4's
Third graders explore math functions by completing problem solving activities. In this division instructional activity, 3rd graders utilize the division strategies acquired earlier to divide multiple digit numbers by 4's. Students...
Curated OER
Guess the Ages
Learners explore scatter plots in this algebra instructional activity. They create a scatter plot from their guesses regarding a famous person’s birth date and the actual birth date then they examine and interpret the results of their...
Curated OER
Rate of Change
Students observe and calculate slopes. In this algebra lesson, students graph equations and determine the pace at which the slope is changing. They use the navigator to see the change as they graph the lines around.
Curated OER
Ordered Pairs on a Coordinate Plane
Seventh graders identify the quadrants and axis of a coordinate plane. In this algebra instructional activity, 7th graders discover the correct way to graph using the coordinate plane. They discuss the relationship between x and y...
Texas Instruments
Making Predictions Using Systems of Equations
Young scholars explore the concept of systems of equations. In this system of equations lesson, students enter data into lists on their calculators about 100 meter dash times. Young scholars plot the points using a scatter plot and...
Curated OER
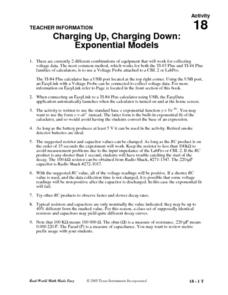
Charging Up, Charging Down
Learners collect and analyze voltage data. Then, they investigate exponential functions using the TI and a Voltage Probe and graph their data and analyze it using a table.
Curated OER
Monopoly Graphs
Learners relate the concepts of linear functions to the game of monopoly. In this algebra lesson, students solve problems with ratio and proportion. They collect data and graph it.


