Curated OER
Reading Graphs
Students read graphs and charts to interpret results. For this algebra lesson, students interpret bar, line and pictographs. They draw conclusions and make predicitons based on these charts.
Curated OER
What Are We Listening To?
Students gather data from a web site on number of music albums sold by genre for the last two years. They convert these figures to fractions, decimals, and percents, and display the results in bar graphs and pie charts.
Curated OER
What's The Weather?
Second graders record and summarize daily weather observations for a week in the form of a bar graph. They cut and glue a weather symbol for each day, record it on the graph, and answer discussion questions.
Curated OER
Graphing Favorite Holidays
Students create spreadsheets and bar graphs based on results of survey of favorite holidays.
Curated OER
More Bait for Your Buck!
Students determine where to buy the heaviest earthworms as they study invertebrates. They create a double bar graph of the results of the weight data.
Curated OER
Smoking: The Real Cost
Third graders discuss the adverse effects of smoking and predict the financial cost of a smoking habit. They collect data regarding the cost of a pack of cigarettes and average packs smoked a day. They create bar graphs displaying the...
Curated OER
Skittles Lab
Students use Skittles as manipulatives to practice computing decimals from fractions, computing decimals into percentages, and creating bar graphs from gathered data.
Curated OER
VH1 Driven: Jamie Foxx, Lesson 3
Students examine the blues, poetry, the Harlem Renaissance, and the 12-bar blues form. They watch a segment from the video, "VH1 Driven: Jamie Foxx," participate in a class discussion, and listen to songs by Ray Charles and a poem by...
Curated OER
Fuel Mystery Dis-Solved
Students describe how temperature and surface area exposure affect the rate at which fuel is consumed. They explain why engineers want to know about the properties of a fuel when designing rockets. They create a bar graph of result data.
Curated OER
Language Arts: Lewin Project
Fourth graders read and respond to the poem, "When I Am Angry." They complete surveys by analyzing the most common feeling and draw a bar graph of their behavior, using different colors to identify the duration of various feelings. ...
Curated OER
Organizing And Reading Data
Students complete three parts of an "Organizning and Reading Data" worksheet. First, they go over the rubric to determine the work will be scored. They organize data by taking tallies, make a pictograph and a bar graph using the data....
Curated OER
Party, Party, Party
Second graders conduct investigations with counting, comparing, organizing, analyzing, displaying and interpreting data. They pose questions for investigation and collect the data. Students display the data in tally charts, uniform...
Curated OER
Why Opposites Attract: Observing Magnetic Fields
Students brainstorm background knowledge and any questions they may have about magnetic fields. They investigate the role that William Gilbert had in laying the groundwork for modern experimental science. Students observe magnetic fields...
Curated OER
Book: Latinos Today: Facts and Figures
Students, after reading Chapter 1 in the book, "Latinos Today: Facts and Figures," identify and characterize the four main ethnic/racial groups in America. They calculate and design a bar graph showing their populations by their...
Curated OER
Bird Beak Adaptation Lab
Students investigate bird beaks to determine which physical adaptations are necessary based on the types of food the birds eat. They participate in a lab by visiting multiple stations to determine which beaks are most efficient, and...
Curated OER
Introduction to Microsoft Word
Second graders elaborate on the classroom writing practices. They locate the various parts of the keyboard such as, space bar, shift key, delete key, etc. They also type a short piece of writing on a word processor. This is a teacher...
Curated OER
Data Collection and Presentation
Young scholars concentrate on discrete quantiative data. They are shown that the vertical line diagram as a more appropriate way to present discrete quantiative data then bar charts. Students work as a group to help with the...
Curated OER
Signin' the Blues with Rock, Rap 'n Roll
Sixth graders listen to recordings and study jazz and the blues music. They identify the instrumentation and explore the 12-bar blues progression. After experimenting with different sound, 6th graders create their own arrangement, with...
Curated OER
Rainforest Data
In this geography worksheet, learners use the climate data given to create a temperature line graph and rainfall bar graph for each of three locations given. Then they use an atlas to compare their graphs and draw conclusions about the...
Curated OER
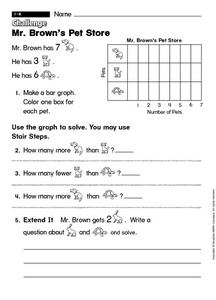
Mr. Brown's Pet Store
In this early childhood problem solving instructional activity, students make a bar graph with the provided information and then use the graph to solve 4 problems.
Curated OER
Pets are for Life
Students research the life spans of several animals and create bar graphs comparing this data. Students, as a class, discuss the long term commitment of owning a pet. Students imagine how their lives would be different if they had a pet...
Curated OER
Destination of Slaves in 1800
In this slave trade activity, students use the provided Atlantic Slave Trade statistics to create a pie chart and a bar graph. Students also respond to 4 short answer questions.
Curated OER
Analyzing Graphs and Data
Students collect and analyze data. In this statistics instructional activity, students graph their data and make inferences from the collected data. They display their data using graphs, bar graphs, circles graphs and Venn diagrams.
Curated OER
Making soap you can use
Those textbook experiments are no good. Using this simple method you can make a real bar of soap. It's
Other popular searches
- Fraction Bars
- Hershey Fraction Bars
- Fractions With Chocolate Bars
- Candy Bars
- Fractions With Hershey Bars
- Math Comparison Bars
- Measurement Bars
- Fractions Fraction Bars
- Fractions and Fraction Bars
- Hersey Bars
- Integer Bars
- Make Fraction Bars


