Curated OER
Narnia Bar Charts
Here is a fabulous presentation that combines math and literature. Learners construct bar charts and frequency charts about things that happen in Narnia. Student pairs are assigned tasks regarding the variety of characters found in the...
Scholastic
Study Jams! Bar Graphs
Mia teaches Sam how to create a bar graph, including forming a title, creating and labeling the axes, choosing a scale, and entering data. After viewing, data analysts can test themselves with seven follow-up questions and review...
Curated OER
Read My Bar Graph!
Elementary schoolers make and use bar graphs to picture information. They learn how choosing the right scale for a bar graph can help make a persuasive argument. This is a terrific lesson on graphing which should excite your kids. There...
Curated OER
Bar Graphs and Survey Questions- Internet Access
In this graphing and data collection activity, students examine a bar chart that show data collected from 1998 - 2006 that shows the percentage of households that have Internet access. They answer questions based on the chart and make...
K-5 Math Teaching Resources
Blank Bar Graph Template
This template is just begging for your young mathematicians to fill it in with colorful bar graphs! With horizontal and vertical axes in place and grid lines for added support, this is a great resource for teaching children how to...
World Wildlife Fund
Bar Charts & Pie Charts
Learn about life in the Arctic while practicing how to graph and interpret data with this interdisciplinary lesson. Starting with a whole group data-gathering exercise, students are then given a worksheet on which they analyze and create...
Curated OER
Five Colors Bar Graph-Make a Bar Graph
Two worksheets are provided here that contain the same information but ask different questions. The first worksheet has the learner draw the graph themselves before answering the questions that follow, and the second worksheet has the...
Curated OER
How to Draw a Bar Chart Correctly
Your class has gathered their data, so what's the next step? They need to display and analyze their data, and a bar chart is a perfect tool for the job. This resource provides the step-by-step instructions those kids need to construct a...
Curated OER
Double Bar Graphs - Homework 7.1
Your learners have seen basic bar graphs, but do they have experience reading double bar graphs? This worksheet details how to draw a double bar graph and provides an example with six accompanying questions. The final question asks...
Curated OER
Double Bar Graphs - Practice 7.1
For this double bar graph worksheet, students make a double bar graph from given information, then solve related problems in addition to 2 test prep problems. Houghton Mifflin text referenced.
Curated OER
Best-Selling Books Bar Graph
Learners fill in bar graphs to show ten of the best-selling students' books of all time. Learners create simple bar graphs to show how many copies of each of the ten books have been sold.
Curated OER
Bar Chart Questions
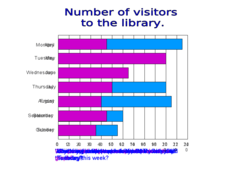
This resource includes two useful slides. Slide 1 is a bar chart that shows the number of people who went to the library in a weeks time, for discussion. Slide 2 includes a similar chart along side 10 data analysis questions for learners...
Curated OER
Drug Sales Soar: Bar Graph
In this graphs worksheet, students analyze a bar graph that shows retail prescription drug sales in the U.S. Students complete five problem solving questions about the data on the graph.
Curated OER
Graphing Canada
Students research a province of Canada choosing a question to investigate. They record their information on a worksheet that is provided and complete a graph. They present their bar graphs to the class.
Curated OER
Create a Graph Online
Scholars create colorful bar, line, or pie graphs. They decide on a survey question to ask or a type of data to gather. From there, they collect information and data. They display this data in bar, line, or pie graphs that they create...
Curated OER
Data Collection
Students write a journal exercise that relates to pets. They collect information from each other in order to practice making and interpreting bar graphs. They Continue building different kinds of graphs with the group.
Curated OER
Likely Outcomes
A coin toss is a simple and fun way to help youngsters discovery probability. Preferably in partners, they first predict what would happen if they tossed two coins 48 times. How often would two heads show up? Two tails? How about one of...
Scholastic
Study Jams! Choosing the Correct Graph
With so many types of graphs, don't let your learners get stuck figuring out which one to use. To track how Zoe spent her allowance, use this interactive lesson to review all the types of graphs and pick the best one to display the data....
Curated OER
Histograms and Bar Graphs
Students examine the use of bar graphs and histograms. In this data representation lesson, students investigate the proper use of bar graphs and histograms to represent data. They learn the proper geometric definitions, experience direct...
Curated OER
Interpreting a bar chart
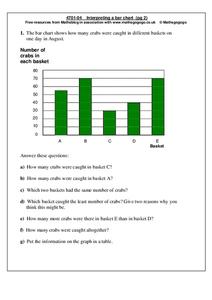
In this bar chart worksheet, students analyze a bar chart and answer 7 questions pertaining to the information on the chart. The answers are on the second page.
Curated OER
Double Bar Graphs (Reteach 15.1)
In this graphs worksheet, students analyze the data on two double bar graphs. Students answer 4 questions about the information on the graphs.
Curated OER
Valentine Candy Heart Bar Graph
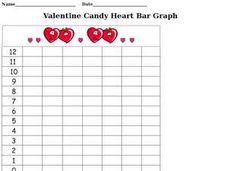
In this Valentine candy heart bar graph worksheet, students complete a bar graph illustrating how many different colored candy hearts they received for Valentine's Day.
Curated OER
Best-Selling Books Bar Graph
Create a bar graph with your elementary school learners. First they read and interpret data, and then they color in the graph (provided) to indicate how many of each were sold. Consider providing them with the data but having them...
Curated OER
Graphs that Represent Data Sets
Use these pre-made data sets to introduce kids to bar graphs and data analysis, and then have them take surveys on their own. There are 10 survey scenarios written out here, and scholars synthesize the results of each into a bar graph....
Other popular searches
- Skittles Bar Graph
- Double Bar Graphs
- Bar Graphs Pictographs
- Histogram and Bar Graph
- Bar Graphs and Histograms
- Bar Graph Problem Solving
- Favorite Food Bar Graph
- Bar Graphs Histograms
- Interpreting Bar Graphs
- Bar Graphs for Birthdays
- Bar Graph Worksheet
- Bar Graphs and Charts


