Hi, what do you want to do?
Curated OER
How Has Math Evolved?
Eighth graders pick a topic or person to research related to the history of mathematics. They brainstorm and create a concept map, using the multimedia software inspiration, about what they are researching and want to examine. They then...
Curated OER
The Big Hand Challenge
Students utilize a computer spreadsheet to record and analyze data. In this problem solving lesson, students compare their hand size to that of the principal. Students understand standard and nonstandard measurement.
Curated OER
Surveying the Land
Students explore the different kinds of maps and the purpose of each. In this Geography lesson, students work in small groups to create a map which includes the use of a map key.
Curated OER
Candy is Dandy
Students investigate color distribution in bags of M&Ms They sort and classify the contents of a bag of M&Ms and summarize their findings on a worksheet. Students convert the numbers into charts and make predictions about color...
Curated OER
Publishing Autobiographies 2
Eighth graders identify the 5th step of the writing process and apply the process to student autobiographies. While in the computer lab, they continue to type their autobiographies, and create covers for their autobiographies.
Curated OER
Positive Future Fair Project
Ninth graders view the film "Pay It Forward" and discuss what kind of public campaign is needed to move people to positive action. They consider different ways of presenting information (graphs, visual displays, etc.) as tools for...
Curated OER
Planet Protectors
Students explore ways to protect the earth. In this environmental issues and technology lesson, students investigate the water quality in their community and compare their findings to the water quality in other geographic...
Curated OER
"One Day in the Prairie" by Jean Craighead George
Students collect "prairie insects" for data collection and analysis.
Curated OER
M&M Caper
Young scholars participate in a game with M&M's to be introduced to percents and ratios. Individually, they estimate and record the number of candies they believe the bag holds and the amount of each colored candy. They open the...
Curated OER
Linking Real World Data to the Classroom
Students analyze data representing real life scenarios.In this algebra instructional activity, students collect, plot and analyze data using a graph. They use different methods to represent and present their data.
Curated OER
The ABC's of Industry
Students define and explore Industry. They access times during the Industrial Revolution in America. Students view how business functions in any economy. They summarize the three sectors of industry by creating and interpreting a web...
Curated OER
Flush It! Throw It! Out of Sight, Out of Mind!
Learners describe disposal procedures by reviewing water and solid waste disposal cycles and what happens when one step is omitted. They examine the connection between industry and human health.
Curated OER
Leaping Lemurs! How far can you jump?
Young scholars watch a segment of the PBS video which show the lemurs' ability to jump. In pairs, students collect measurement data involving each other's length of a standard step, a standing broad jump, and a long jump. They record...
Curated OER
The Ultimate Sacrifice
Students explore the concept of sacrifice during wartime. In this World War II instructional activity, students explore the Allied and Axis Powers that existed during the war. Students discover sacrifices that were made by both powers...
Curated OER
Coin Probability
Fourth graders, in pairs, receive three different types of coin bags. They pick coins out of the bag and tally what was picked fifteen times. They do it with all three bags for three separate tallies.
Curated OER
Picture a Nation
Students research immigration data from a specific time period. They create a graphic organizer that depicts the information and share the information with the class.
Curated OER
An Apple A Day
Young scholars create a graph that showcases their pick for favorite kind of apple. Students are given samples of a variety of apples to determine their favorite in a taste test. They a create a tally chart of favorite kinds apples and...
Curated OER
Virginia In the World: The Geography of Commerce
Middle schoolers examine how Virginia connects with the world through export trade. Using a map, they use symbols to depict the value of trade and the direction of the flow of goods. They complete a scavenger hunt using electronic...
Curated OER
MFL: Young Drivers
Students examine and discuss images from road safety programs. In groups, they role-play a scenerio in which they are trying to persuade the other to adopt an unsafe driving practice. They write a short article about their experiences to...
Curated OER
Population Pyramids
High schoolers create a population pyramid based on current data for their final project country. They analyze data from comprehension trends of final project country. Students analyze populations of specific countries.
Curated OER
Thank You... Thomas Edison!
Learners investigate the life of Thomas Edison. They research how he made a difference. They understand that accurate data collection is important for math. They create a chart using spreadsheet data.
Scholastic
Scholastic: Bars, Lines, and Pies
Students will learn and reinforce skills for creating, applying and analyzing pie charts, bar graphs and line graphs.
National Center for Ecological Analysis and Synthesis, University of California Santa Barbara
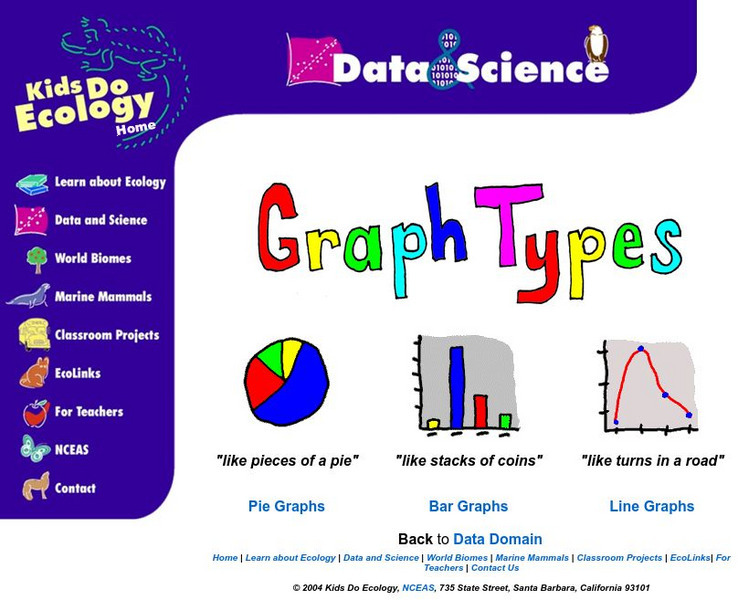
Nceas: Graph Types
At this site from NCEAS you can learn how to organize your data into pie graphs, bar graphs, and line graphs. Explanations and examples are given of each graph along with several questions that check comprehension.
E-learning for Kids
E Learning for Kids: Math: Elephant Plant: Data and Graphs
On this interactive website students practice various math skills using a real-life scenario involving plants. Those skills include interpreting data in a circle graph, interpreting data in a divided bar graph, and interpreting a bar...


