Hi, what do you want to do?
Curated OER
Climate Comparison
Students explore climate regions. In this climate lesson plan, students examine the climate regions of Alaska as well as the state of Hawaii. Students research selected Internet sources to gather information regarding the climates...
Curated OER
How Unique Are You?
Students explore how genetic information is passed down from parent to offspring. Because of this, they examine how this causes the variation in each species.
Curated OER
Lucky Charms Pictograph
Third graders create pictographs using a breakfast cereal. This fun, hands-on instructional activity allows students to use Lucky Charms cereal to create a pictograph. When the instructional activity is through, 3rd graders get to eat...
Curated OER
Bon Voyage Math
Sixth graders investigate the cost of throwing a party. In this cost of throwing a party lesson, 6th graders have to throw a going away party for 2 exchange students given a $350 budget. Students work in groups to determine...
Curated OER
Bullying-studying it to curb it....
Students will engage in a variety of research activities to write what the latest facts are concerning the issue of bullying. This issue is relevant to the lives of learners in schools, which will make for an high interest lesson.
Curated OER
"The Science Times"
Young scholars create their own newspaper after gathering information at the Museum of Natural History's Hall of Biodiversity.
Curated OER
A Bird's Eye View of our 50 States
Third graders focus on state birds as they learned absolute location (latitude/longitude) of each state, as well as their relative location (bordering states).
Curated OER
Investigation of Timbre
Students design an experiment to analyze the timbre of different instruments. In this physics lesson, students analyze the missing quality in sound. They discuss their results in class.
Curated OER
Peekikng At Public Sculpture
Students use the internet to investigate public examples of sculpture. They reflect upon the possibility of being a reference of lifestyles that can exist in a society. A variety of media sources serve as inspiration for the lesson.
Curated OER
Weather Patterns
High schoolers use yearly averages over a five-year period to understand weather trends for a specific area.
Curated OER
Rolling Records
Fourth graders play a game to determine the likelihoods of different outcomes when rolling two number cubes. Students play a game to determine the likelihoods of different outcomes when rolling two number cubes.
Curated OER
A Rainbow Under the Sea: How Do Animals Survive in the Ocean?
Second graders, with adult help, create a PowerPoint presentation on a selected ocean animal.
ArtsNow
Arts Now Learning: We Are Living Graphs and Data [Pdf]
In this lesson, 3rd graders use their own bodies to create bar graphs and do problems involving addition, subtraction, and more or less amounts. They then create their own graphs, incorporating the features of graphs that they have...
Shodor Education Foundation
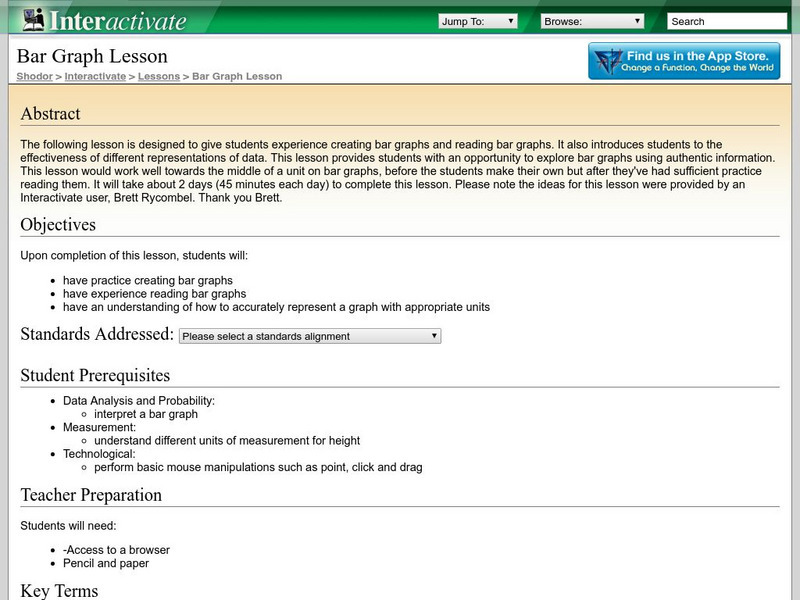
Shodor Interactivate: Lesson: Bar Graph
This lesson plan is designed to give students practice creating and reading bar graphs as well as understanding how to accurately represent a graph with appropriate units.
Scholastic
Scholastic: Bars, Lines, and Pies
Students will learn and reinforce skills for creating, applying and analyzing pie charts, bar graphs and line graphs.
PBS
Pbs Kids Afterschool Adventure!: Operation: Data Saves the Day Activity Plan
Data comes to the rescue! Children will collect, analyze, and represent data as they try to dodge a series of catastrophes faced by characters from their favorite PBS Kids shows.
Better Lesson
Better Lesson: Building Our Own Bar Graphs (Part I)
Second graders use data to create a tally chart and make a bar graph. This lesson plan includes a detailed plan, videos of students engaged in the lesson plan, and printable worksheets.
Texas Instruments
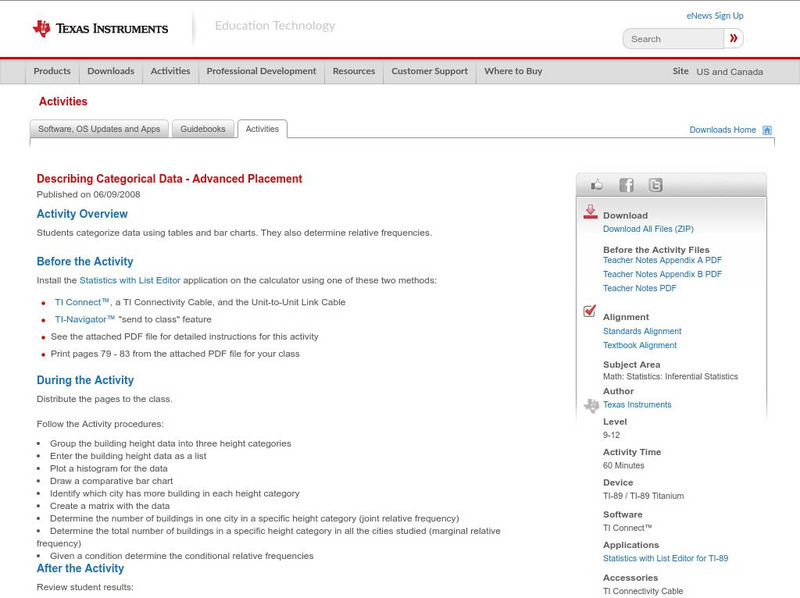
Texas Instruments: Describing Categorical Data Advanced Placement
Students categorize data using tables and bar charts. They also determine relative frequencies.
Texas Instruments
Texas Instruments: Describing Categorical Data
Students analyze the distribution of categorical data. They calculate percents and visually compare the data sets with a bar chart.
Shodor Education Foundation
Shodor Interactivate: Comparison of Univariate and Bivariate Data
Young scholars learn about the difference between univariate and bivariate data and understand how to choose the best graph to display the data.
PBS
Pbs Learning Media: Curious George Stem: Graphing Lesson Plan
A hands-on lesson plan where students compare and analyze data from their graphs.
Better Lesson
Better Lesson: Fast Food Freddie Surveys and Bar Graphs
Students continue to build their graphing skills. They experience a real world application of graphing by organizing survey results.


![Arts Now Learning: We Are Living Graphs and Data [Pdf] Lesson Plan Arts Now Learning: We Are Living Graphs and Data [Pdf] Lesson Plan](https://static.lp.lexp.cloud/images/attachment_defaults/resource/large/FPO-knovation.png)


