Curated OER
Choosing the Best Graph
In this mathematics worksheet, 6th graders use a line graph to illustrate how a measure of data changes and explain their reasoning. Then they use a bar graph to compare pieces of data and a pictograph to compare data.
Curated OER
Counting And Graphing
Students explore counting and graphing. In this math lesson plan, students practice counting from 1-25 and are exposed to two types of graphs: the pie graph and the bar graph. Students use Skittles to represent a variety of measurements.
Curated OER
M&M's Candies Worksheet Graph
In this graphing worksheet students will record data on a bar graph. Students will take a bag of M&M's and chart the colors they find inside this bag.
Curated OER
What's in a Graph?
Students explore how to use and interpret graphs. The graphs are pulled from a variety of sources, and the activities ask students to interpret graphs. They start this lesson with knowledge of what a graph is. Students also know how to...
Curated OER
Counting Candies
Students count, sort, and classify jellybeans by color. They use their data to create a bar graph. Students are given a small bag of jellybeans, and a worksheet on Counting Candies Tally Chart. They work in small groups. Students are...
Curated OER
Probability Using M&M's
Students estimate and then count the number of each color of M&M's in their bag. In this mathematics lesson, students find the experimental probability of selecting each color from the bag. Students create pictographs and bar graphs...
Curated OER
Make a Bar Graph
In this bar graphs worksheet, students use the tally chart to make a bar graph. Students color one box for each tally mark and then use the chart to help answer the questions about the sunny, cloudy, and rainy days.
Curated OER
Conversation Heart Graphing
Sixth graders review the different types of graphs (bar, line, pictograph) They predict the data set they can garner several boxes of conversation hearts. Students record their data using an Excel spreadsheet. They create a graph based...
Curated OER
Bluebird Eggs in Nestbox chart
For this bluebird eggs worksheet, students fill out the chart which resembles a bar graph on how many eggs each bluebird has and answer short answer questions. Students answer 5 questions.
Curated OER
Comparing Data on Graph A and Graph B
Second graders gather and graph data. In this graphing lesson, 2nd graders collect data and graph this information using tally charts, bar graphs, pictographs, or tables. They make predictions about the outcomes.
Curated OER
Favorite Vegetable Survey
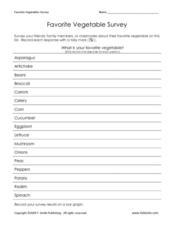
What's your favorite? Use this chart template in your lesson on data collection and graphing. Learners record classmates' favorite vegetable in a survey, and then graph the results. A labelled graph is provided here- print both pages...
Willow Tree
Histograms and Venn Diagrams
There are many different options for graphing data, which can be overwhelming even for experienced mathematcians. This time, the focus is on histograms and Venn diagrams that highlight the frequency of a range of data and overlap of...
National Security Agency
Starting a Restaurant
Through an engaging unit, chefs-in-training will sort and classify data using tally charts. Learners will also create bar graphs to display restaurant data and interpret data from bar graphs using a variety of categories. This is a fun...
Mathed Up!
Tallys and Charts
After watching a brief instructional video, young mathematicians are put to the test. By completing and reading frequency tables, tally charts, and bar graphs, individuals show their understanding of how to interpret data.
Curated OER
Bar Graphs
Students perform operations and graph their data using charts and bar graphs. In this algebra lesson, students follow specific steps to make a bar graph. They create a survey about people favorite things and plot their data from the...
Curated OER
Comparing School Bus Stats
Engage in a lesson plan that is about the use of statistics to examine the number of school buses used in particular states. They perform the research and record the data on the appropriate type of graph. Then they solve related word...
Curated OER
Twelve Days of Christmas--Prediction, Estimation, Addition, Table and Chart
Scholars explore graphing. They will listen to and sing "The Twelve Days of Christmas" and estimate how many gifts were mentioned in the song. Then complete a data chart representing each gift given in the song. They also construct...
Curated OER
Creating Bar Graphs and Pie Graphs
Second graders observe a demonstration of the creation of a bar graph and a pie graph of their favorite colors. They gather information about various topics from their classmates, then organize the information, creating a bar and a pie...
Curated OER
Types of Graphs
Fifth graders construct graphs. In this graphing lesson, 5th graders learn about various types of graphs such as bar, line, circle, picture and stem and leaf plot. Students work in groups to create examples of each graph.
Curated OER
Ice Cream Scoop
In this data display worksheet, students write 6 flavors of ice cream on pieces of paper. Students choose papers one at a time and keep track on a tally sheet. Students make a bar graph of the results.
Curated OER
Data Collection and Presentation
Middle and high schoolers collect and analyze data from four different activities. The activities include information about classmates, tallying colors of cars in a parking lot, stem and leaf plots, and making a histogram from winning...
Curated OER
Quantitative Data
In this quantitative data worksheet, pupils compute measures of central tendency, draw vertical line diagrams, and compare collected data. This 23-page worksheet contains approximately 100 multi-step problems. Explanations and examples...
National Security Agency
Line Graphs: Gone Graphing
Practice graphing and interpreting data on line graphs with 36 pages of math activities. With rationale, worksheets, and assessment suggestions, the resource is a great addition to any graphing unit.
Alabama Learning Exchange
What's Your Favorite Chocolate Bar?
Students complete a math survey. In this math graphs instructional activity, students complete a survey about their favorite candy bars. Students create different kinds of graphs using Microsoft Excel to show their results.


