Curated OER
Weather
Students create a spreadsheet and chart using data collected. In this weather instructional activity, students select five cities from their state, including the city they live in. Students take daily temperature readings...
Curated OER
Marketing Occupations
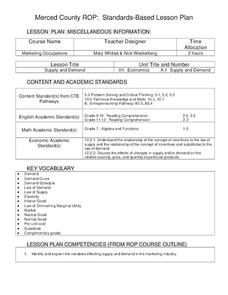
Young scholars identify and explain the variables effecting supply and demand in the marketing industry. Then they define the terms supply and demand and graph supply and demand curves on a standard grid. Students also formulate what...
Curated OER
Presentation of Quantitative Data- Vertical Line Diagrams
For this quantitative data worksheet, students examine how vertical line diagrams can be used to display discrete quantitative data. They read about the use of tally charts to create vertical line graphs that display the data. They...
Curated OER
Scaffolding Academic Learning for Second Language Learners
Students walk through exposure to material on Great Inventions and Transportation using scaffolding techniques such as: language simplification, pre-reading, graphic organizers, note taking and more.
Virginia Department of Education
Normal Distributions
Pupils work to find probabilities by using areas under the normal curve. Groups work to calculate z-scores and solve real-world problems using the empirical rule or tables.
West Contra Costa Unified School District
Talking About Distance, Rate and Time
Connect the tortoise and the hare fable to mathematics. Learners first identify key terms related to distance, rate, and time. They then solve distance/rate/time problems using different representations.
Alabama Learning Exchange
The Very Hungry Class
Students listen to a read aloud of Eric Carle's, The Very Hungry Caterpillar, as an introduction to their study of the metamorphosis of a butterfly. They participate in a number of cross-curricular activities in this unit of lessons.
Curated OER
Jelly Belly: What a Wonderful "Bean"!
Students explore how jelly beans are produced. They discuss the origins of the jelly bean and view a video about how jelly beans are prepared, tested, shaped, finished, and shipped and estimate the amount of jelly beans in a jar and sort...
Curated OER
Favorite Farm Animals
Students perform a study of farm animals and their babies. They compile a graph of their favorite farm animals. They utilize a spreadsheet worksheet which is imbedded in this plan.
Curated OER
Butterflies in the Garden
Students estimate the population of a butterfly ecosystem and create a chart and graph based on information they find.
Curated OER
Mr. Cobbler's Shoe Dilemma
Students employ statistics to solve real-world problems. They collect, organize and describe data. They make inferences based on data analysis. They construct, read, and interpret tables, charts and graphs.
Curated OER
Making a Map
Students are introduced to maps by examining the various types and practice using a key to find information. They each create their own map with a key and graph information. As a class, they read the story "Henny Penny" and share their...
Curated OER
Novel Response "The Night of The Twisters"
In this language arts activity, students graph interest in each chapter that is read in the book Night of The Twisters. They use the graph to analyze class opinion of the book.
Curated OER
Odd and Even Numbers
First graders practice number identification by reading a story in class. For this number sense lesson, 1st graders read the story A Wish for Wings that Work and identify objects within the book's photographs. Students count the number...
Curated OER
What is My Favorite Apple?
Students decide on their favorite apple and together make a graph.
Curated OER
Who Do You Want For Your Friend?
Second graders create a t-chart about the healthy and unhealthy characteristics in relationships. They discuss elements they should look for in a friend. They are read books to identify these elements.
Curated OER
A Country’s Shape Is More Than Its Borders
In this geography skills worksheet, students read an article and examine graphs about population prior to answering 13 short answer questions and 10 multiple choice questions. Students then respond to the writing prompt about population.
Curated OER
Using Diagrams in Problem Solutions
Students use tables, graphs and diagrams to collect data. In this problem solving with diagrams lesson plan, students construct their own tables and graphs containing information they gather from a drawing. They also make a Venn Diagram...
Curated OER
Labeling the World
Sixth graders conduct research on the countries found on the labels on their clothing. They locate the countries on a map, research the labor practices on countries that export clothing to the U.S., and create a graph using the information.
Curated OER
Statistics Newscast in Math Class
Young scholars study sports teams, gather data about the teams, and create a newscast about their data. For this sports analysis lesson, students research two teams and define their statistical data. Young scholars compare the two teams,...
Curated OER
Sleep Central
First graders explore healthy and unhealthy sleeping habits. They make a class graph of the total number of hours students, as a class, sleep for the week.
Curated OER
The Home Stretch
Students read the novel Stone Fox by John Reynold Gardiner. Using Lego RCX units, students build and program sleds to re-enact the "home stretch" of the National Dog Sled Race.
Curated OER
People of the Earth
Students explore the rich culture of the southwestern Native Americans through the integration of curriculum. Pupils read and research stories about Native Americans. They write an essay about Native Americans. Additional cross...
Curated OER
Seashore Sweep
Students gather information about sea animals. In this ocean lesson, students read a story about the ocean and seashore. They discuss the needs of seashore animals and create a Mystery Ocean Animal riddle book. Students also discuss...

