PBS
Data Plots of Exoplanet Orbital Properties
Scientists discovered the first exoplanet in 1995 and by early 2018, they confirmed the existence of more than 3,700—that's a lot of data! As part of the PBS 9-12 Space series, scholars interpret data about exoplanets. They compare...
Concord Consortium
Function Project
What if a coordinate plane becomes a slope-intercept plane? What does the graph of a linear function look like? Learners explore these questions by graphing the y-intercept of a linear equation as a function of its slope. The result is a...
Amani Project
Teach the Mood Meter
The third activity from the Amani Project has youths create a Mood Meter. The colorful meter, divided into red, yellow, blue, and green squares, lets participants indicate not only how they are feeling but also permits them to indicate...
Curated OER
Bell Curve
Young scholars explain normal distribution of a measurable characteristic within a group of objects. They create two graphs (one for each type of Hershey's Kiss) with increments of measurement on the X-axes and number of measurements on...
Curated OER
Length of an Arc
Students compute the length of an arc and each hypotenuse in the give figure, adding them up in the end. They then develop the formula for the arc length with respect to the x-axis and the y-axis. Students also develop a formula for the...
Curated OER
Coordinate Grid
In this math learning exercise, students plot points on a coordinate grid. The grid ranges from positive ten on the x-axis to positive ten on the y-axis.
Curated OER
How Much Will I Spend On Gas?
Students construct a linear graph. In this graphing lesson plan, students determine a monthly budget for gasoline. Students construct a t-chart and coordinate graph to display data. Resources are provided.
Curated OER
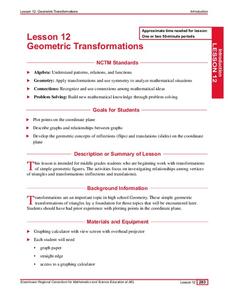
Geometric Transformations
Students solve problems involving transformations of geometric figures. They review graphing points in the coordinate plain, plot points and connect to create a triangle. Then, they reflect triangles over the x and y axis and use...
Curated OER
Graphs of Logarithmic and Exponential Functions
Young scholars watch as the teacher demonstrates that y=ln(x) and y=e^x are inverse functions. They graph these equations on the same axes. Students work other log functions. They learn a Reggae Song about the log of the quotient. Young...
Curated OER
Games, Grids, and Graphs
In this math worksheet, middle schoolers look for the relationships between ordered pairs. They find the missing values and plot them on the x and y axis.
Curated OER
Discussion Sheet 2
In this math worksheet, students consider a two dimensional graph and then create two equations for revolving it around the axes.
Curated OER
Solving Linear Systems By Graphing
In this graphing worksheet, learners solve 2 linear systems by graphing the equations on the given x/y axis. They record their answers in the graph.
Curated OER
Write Equations of Lines
In this geometry worksheet, 5th graders write or apply the equations for lines to solve 6 word problems. They see the x, y axis for each line to aid in solving the problems.
Curated OER
Making A Horizontal Bar Graph
In this bar graph worksheet, students create a bar graph to display 6 scores from basketball games. Students will label the x and y axis and correctly plot the scores from the table provided.
Curated OER
Graph Paper 2
In this blank graph paper worksheet, students use the gridded sections that may be marked off on the x and the y axis as directed by their teachers.
Curated OER
Make a Line Graph
In this make a line graph learning exercise, 6th graders make a line graph for 2 sets of data, using a blank grid, by plotting the numbers, labeling the x and y axes and writing a title.
Curated OER
How Do They Relate? Linear Relationship
Students collect information and use a line to represent it. In this algebra lesson, students investigate real world data to see if it makes a line. They graph the line comparing the relationship of the x axis with that of the y axis.
Curated OER
Bell Curve
Students explore averages by completing a data analysis activity. In this bell curve instructional activity, students measure different food items and plot their measurements on a X and Y axis. Students create bell curves around the...
Curated OER
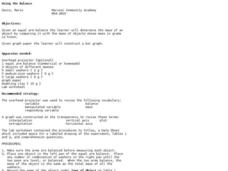
Using the Balance
Students determine the mass of various objects. In this integrated math and science lesson, students use an arm balance to compare a known object to a combination of washers with a fixed weight. Students record data, construct a bar...
Curated OER
Magnetic Storms
In this magnetic storms worksheet, students use a graph of data collected over time showing the magnitude of a magnetic storm. Students use the data to solve 6 problems about the graph and they determine the strength of the storm at...
Curated OER
Lesson #2 Absolute Value and Symmetry
Students investigate absolute value functions. In this Algebra II/Pre-calculus/Calculus lesson, students explore the formal definition of absolute value and apply the piece-wise definition to solve inequality problems. Students explore...
Curated OER
Track's Slippery Slope
Learners graph data of sports figure running time using x-axis y-axis to find slope of trend line, mathematically find the interpolated and extrapolated values for data points. Using the information they make predictions.
Curated OER
Reflections of a Linear Function
Students identify and reflect functions about the X-axis, Y-axis, and origin. They derive equations for reflected functions and graph the linear functions. Finally, students identify that f(x) can be reflected about each axis and the...
Curated OER
Worksheet 7, Polynomials
In this algebra worksheet, students graph 3 polynomial functions. They find the intercepts, and the intervals above the x axis. Students create their own polynomials with given characteristics.
Other popular searches
- X and Y Axis
- X Y Axis
- Reflection X Axis
- X and Y Axes
- Dependent Axes
- Axis (Axes
- Axes 0
- Stone Axes
- Graphing X Y Axis
- Independent Axes
- Reflection Across X Axis
- Horizontal and Vertical Axes


