Curated OER
Understanding Pi.
Students study the relationship between circumference and diameter to come up with Pi. "In this pi lesson, students measure, record and find the ratio "circumference/diameter" and their average which is an approximation of pi.
Curated OER
Electromagnetic Spectrum
In this electromagnetic spectrum worksheet, students review all regions of the spectrum in order from longest to shortest wavelength. Students list all possible values for specific quantum numbers. This worksheet has 20 problems to solve.
Curated OER
Mode, Median, Mean
In this mean, median, and mode activity, students find the mean, median, and mode for each set of numbers given. Students complete 5 problems total.
Curated OER
Sub-Atomic Particles and Energy
In this atomic particles activity, students complete an elements chart comparing atomic number, mass number, protons, neutrons, and electrons. Students write the electron configuration for atoms. This activity has 1 graphic organizer and...
Curated OER
Distinguishing Between Atoms
Every type of question is used to query young chemists about atomic structure. A vocabulary list tops the page before fill in the blanks, true/false, and matching questions are listed. This is a neatly formatted and pertinent worksheet...
Curated OER
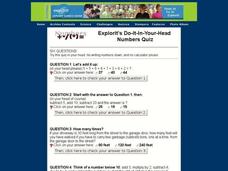
Explorit's Do-It-In-Your-Head Numbers Quiz
In this mental math activity, students complete a 6 question multiple choice online interactive activity without using pencil, paper or calculator. Included are word problems, multiple operations, averaging, and basic arithmetic.
Curated OER
I Can Average Grades Like My Teacher!!!
Fifth graders investigate the mean of a data set. In this fifth grade mathematics instructional activity, 5th graders determine the mean of sets of numbers using a calculator. Students use a blank role book page to create grades for...
Curated OER
Speeding By The Numbers
Students determine speed by running or walking a given distance and dividing the distance by the time it took them to do so. They record their average speed and compare it with the speeds of other moving objects.
Curated OER
The Numbers Behind Hunger: Rate of Change
Explore the concept of world hunger by having students collect and graph 1990 world hunger statistics. They will analyze the data in order to determine how to decrease world hunger rates and try to determine problems and solutions of...
EngageNY
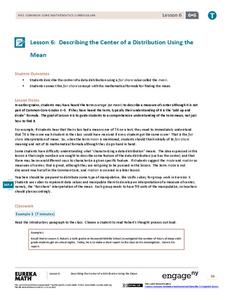
Describing the Center of a Distribution Using the Mean
Everyone does their fair share. The sixth segment in a 22-part unit presents the mean as a fair share. Groups build a conceptual understanding of the mean of a data set, rather than simply learn an algorithm. Learners use the...
Curated OER
Signed Numbers
In this signed numbers worksheet, 6th graders solve and complete 4 different types of problems. First, they calculate each problem using a number line. Then, students solve each word problem as indicated.
Curated OER
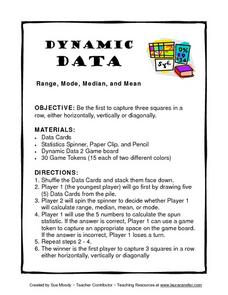
Dynamic Data Range, Mode, Median, and Mean
For this lesson, Dynamic Data Range, Mode, Median, and Mean, young scholars play a game while figuring range, mode, median, and mean. Students spin for their task, figure the mode, mean, median or range of a row of numbers and gain a...
Curated OER
Finding Averages
Students have problems in the lesson where they need to find the average of a set of numbers. As a class, they work a few problems and then independently complete a worksheet practicing their new skill.
Curated OER
Mathemafish Population
It's shark week! In this problem, young mathematically minded marine biologists need to study the fish population by analyzing data over time. The emphasis is on understanding the average rate of change of the population and drawing...
Yummy Math
Diapers
Most of your learners probably think a car or college is the first big expense their parents could help them with, but as it turns out these kids have been costing their parents for their whole lives. Have they ever considered how much...
Curated OER
A Trillion Here...A Trillion There
In this working with large numbers worksheet, students are given the finance statistics for the US and the world for the 2006-2007 year. Students solve 11 problems including finding averages and percentages for the given statistics and...
Curated OER
I Breath What? Activity-Pollution Detector Worksheet
In this pollution worksheet, students collect particles using a pollution detector and then observe their results under the microscope. They calculate the average number of particles collected in three different locations. They draw...
Curated OER
Data Management and Probability: Applications
For this data management and probability applications worksheet, 8th graders solve 20 various types of probability problems. They find the mean, median, mode and range of various numbers. Then, students use the spinner illustration to...
Curated OER
Number Sense and Operations
In this number sense and operations worksheet, 9th graders solve and complete 15 various types of multiple choice problems. First, they evaluate a few different functions shown. Then, students write numbers given in scientific notation....
Raytheon
Working With Mode, Median, and Mean
For this data analysis worksheet, students solve five questions by finding the mode and median of each set of numbers. On the second page, students find the mean of six sets of numbers. On the third page, students find the mode, median,...
Curated OER
Unit 8 - Statistical Diagrams
In this statistical diagrams learning exercise, students solve 30 short answer problems. Students find the mean of a set of numbers and read/interpret a graph to answer questions. Students determine the x-values that satisfy a y-value...
Curated OER
Investigation (Houghton Mifflin Math)
In this number sense worksheet, students explore the Grand Canyon. Students are to find five facts about the Grand Canyon that contain a number greater than the number one thousand.
Curated OER
www.tutor-usa.com worksheet
Algebra learners can practice solving one-step equations using both addition and subtraction with decimal numbers. A few problems challenge the pupil to write and solve their own equation based on information given in a table.
Curated OER
Handling Data: measure of Average
Fifth graders analyze data from a simple table. In this graphing lesson, 5th graders compare distributions. Students recognize that the mean helps them find the formula. Students answer questions on the mean, median, and range.


