Curated OER
Creating a Thematic Map
Students create and analyze a weather-related data table and a thematic map based upon information provided.
Curated OER
The Weather
Students explore earth science by reading articles in class. In this weather identification lesson, students analyze weather science articles on the Internet and view their own local weather patterns as well. Students define a list of...
Curated OER
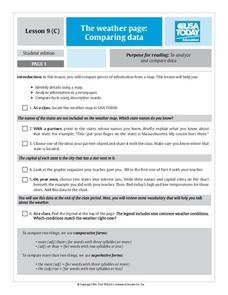
The Weather Page: Comparing Data
Students analyze data from maps. In this comparing data lesson plan, students use comparative and superlative statements to draw comparisons among the weather in different American cities based on USA Today weather maps.
Curated OER
Isolines on a Weather Map
Ninth graders explore weather by analyzing maps. In this temperature lesson, 9th graders view black and white weather maps of locations in which the weather changes often. Students identify the isolines used on the maps and utilize the...
California Academy of Science
California's Climate
The United States is a large country with many different climates. Graph and analyze temperature and rainfall data for Sacramento and Washington DC as you teach your class about the characteristics of Mediterranean climates. Discuss the...
Curated OER
Weather, Data, Graphs and Maps
Students collect data on the weather, graph and analyze it. In this algebra instructional activity, students interpret maps and are able to better plan their days based on the weather reading. They make predictions based on the type of...
Curated OER
Make Your Own "Weather" Map
Pupils create their own "weather" map using data from x-ray sources. They analyze and discuss why it is important to organize data in a fashion in which is easy to read. They compare and contrast different x-ray sources using a stellar map.
NASA
Hurricanes and Hot Towers with TRMM
Take cover because a wild presentation on hurricanes is about to make landfall in your classroom! An outstanding PowerPoint presentation is the centerpiece of this instructional activity. Not only does it provide information and...
Curated OER
Analyzing Meteorological Data From Mars
Students compare real-time Earth and Mars measurements for temperature, wind speed, humidity and atmospheric pressure by accessing Internet-data resources from NASA. They access real-time weather data and maps for their school location.
Curated OER
Make Your Own "Weather" Map
Students develop and apply a variety of strategies to solve problems, with an emphasis on multi-step and non-routine problems. They acquire confidence in using mathematics meaningfully.
Living Rainforest
Finding the Rainforests
From Brazil to Indonesia, young scientists investigate the geography and climate of the world's tropical rain forests with this collection of worksheets.
Curated OER
Studying Snow and Ice Changes
Learners compare the change in snow and ice over a 10 year period. In this environmental science lesson, students use the live data on the NASA site to study and compare the monthly snow and ice amounts on a map of the entire...
Curated OER
Math Hunt: Extreme Weather
Students investigate integrals. In this math lesson plan, students relate real world situation to investing. They may visit a local business to do this assignment.
Curated OER
NIGHT AND DAY: DAILY CYCLES IN SOLAR RADIATION
Students examine how Earth's rotation causes daily cycles in solar energy using a microset of satellite data to investigate the Earth's daily radiation budget and locating map locations using latitude and longitude coordinates.
Curated OER
Cold, Clouds, and Snowflakes
Students explore satellite data and graphing. In this weather data analysis math and science lesson, students analyze NASA satellite data to draw conclusions about geographical areas where precipitation might have happened. Students...
Curated OER
High Mountain Retreat
Students explore and analyze atmospheric conditions for a high mountain retreat. They examine the relationship between altitude, atmospheric pressure, temperature and humidity at a particular location. In addition, they write reports...
Curated OER
Scatter Plots
Seventh graders investigate how to make and set up a scatter plot. In this statistics lesson, 7th graders collect data and plot it. They analyze their data and discuss their results.
Curated OER
Climate Systems - Which Location Is Best For Me?
Students study the difference between weather and climate. In this climate systems lesson students search the Internet for the parts of the Earth's system, gather climate data and complete a challenge scenario.
Curated OER
Trouble in the Troposphere
Students Use data sets from MY NASA DATA to produce graphs comparing monthly and yearly ozone averages of several U.S. cities. They analyze and evaluate the data and predict trends based on the data. In addition, they discuss and...
Curated OER
Hurricane Frequency and Intensity
High schoolers examine hurricanes. In this web-based meteorology lesson, students study the relationship between ocean temperature and hurricane intensity. They differentiate between intensity and frequency of hurricanes.
Curated OER
The Lake Effect
Fourth graders conduct an experiment demonstrating the effects of water and air temperature on precipitation. They create graphs demonstrating their findings using Claris Works for Kids.


