Hi, what do you want to do?
Curated OER
Affects of Geography on Colonial Cultures
Sixth graders examine the effects of geography on the development of culture. They discuss how geography can affect the lifestyles and development of a society's culture. Students examine the geography and climate of New England and the...
Curated OER
Blowing in the Wind
Students compare hurricanes and tornadoes. They write a paragraph explaining how to prepare for a storm. Students give an oral report. They use weather facts to practice math skills. Students record observations of a storm.
Curated OER
Lewis and Clark
Ninth graders study the plants and animals Lewis and Clark discovered on their expedition. There is a plant illustrator, a plant recorder, an animal illustrator, and an animal recorder. They research the plants and animals and the ...
Curated OER
Science: Backyard Bugs Data Collection
Students practice data collection skills by observing common bugs found in their local environment. Once the data is collected they complete data sheets to compare, contrast, sort, and classify the insects. The lesson includes...
Curated OER
Quarter Coin Cookies
Students study the historical figures and symbols of U.S.
patriotism depicted on the penny, nickel, dime, and quarter coins. They explore the processes involved in making coins, and how metals canchange in consistency from the...
Curated OER
What Does a Quarter Weigh?
Students study the historical figures and symbols of U.S.
patriotism depicted on the penny, nickel, dime, and quarter coins. They
create a balance scale from common materials to measure the approximate weight
of a quarter.
Curated OER
What are Quarters Made of?
Students study the meaning, symbolism, and value of U.S. coins,
especially the quarter. They l research why in 1965 the U.S. Mint decided to
change the metal composition of the quarter to copper coated with zinc. In addition, they...
Curated OER
Cultural "I Amm" Speech Project
Eleventh graders use the internet and other sources to research a selected individual. They explore important events, challenges, and the impact and influence the person had on US History. Using the information gathered, 11th graders...
Curated OER
The "Coal LIfecycle" Scrapbook
Students discover how coal is formed. In this science instructional activity, students create a scrapbook on the life cycle of coal and show how coal is formed by showing pictures of each stage.
The Franklin Institute
Frankin Institute Online: Group Graphing
This site from The Franklin Institute explores how to make a simple graph using a spreadsheet to portray survey data. It also gives a set of interesting sports-related web sites so that students can get statistical inforamtion.
Texas Education Agency
Texas Gateway: Analyze Graphical Sources: Practice 2 (English I Reading)
This lesson focuses on practice exercises to understand and interpret the data in a graphic representations including pie charts, bar graphs, and line graphs.
Better Lesson
Better Lesson: Circle Graph Activity
This lesson will allow the student to work through three stations. The stations will focus on creating and analyzing circle graphs. The students will be using technology to create their graphs along with a hands-on activity using M&M's.
Texas Education Agency
Texas Gateway: Analyzing Two Dimensional Motion
Given descriptions, illustrations, graphs, charts, or equations, students will analyze motion in two dimensions, including projectile and circular motion.
Scholastic
Scholastic: Bars, Lines, and Pies
Students will learn and reinforce skills for creating, applying and analyzing pie charts, bar graphs and line graphs.
Texas Education Agency
Texas Gateway: Analyze Graphical Sources: Practice 2 (English I Reading)
You will look at each of these types of graphs: bar graph, line graph, pie charts, as you work your way through the lesson.
Texas Education Agency
Texas Gateway: Analyze Graphical Sources: Practice 2 (English Ii Reading)
[Accessible by TX Educators. Free Registration/Login Required] Analyze the factual, quantitative, and technical data in graphs and charts.
Better Lesson
Better Lesson: Circle Graph Activity
This lesson will allow the student to work through three stations. The stations will focus on creating and analyzing circle graphs. The students will be using technology to create their graphs along with a hands on activity using M &...
ClassFlow
Class Flow: Charts Handling Data
[Free Registration/Login Required] Reading graphs fit together with this engaging, colorful flipchart analyzing pie charts, bar graph, percents, and fractions.
Other
Tulpehocken Area School District: Graphing and Analyzing Scientific Data
Student worksheet with explanation of pie, bar, and line graphs, the parts of a graph, and the definition of mean, median, and mode. This summary is followed by an exercise for each type of graph within a scientific context.
Better Lesson
Better Lesson: Analyzing and Creating Circle Graphs
Sixth graders will be learning through exploration on how to analyze and create circle graphs and Venn diagrams.
Texas Education Agency
Texas Gateway: Analyze Graphical Sources: Practice 2 (English I Reading)
Analyze the factual, quantitative, and technical data in graphs and charts.
Sophia Learning
Sophia: Using Graphs to Analyze Data
This lesson will demonstrate how to analyze and interpret data given in the form of a graph.
Oswego City School District
Regents Exam Prep Center: Practice With Organizing and Interpreting Data
Several problems are presented to test your skills in creating and interpreting frequency tables, pie charts, box-and-whisker and stem-and-leaf plots.
PBS
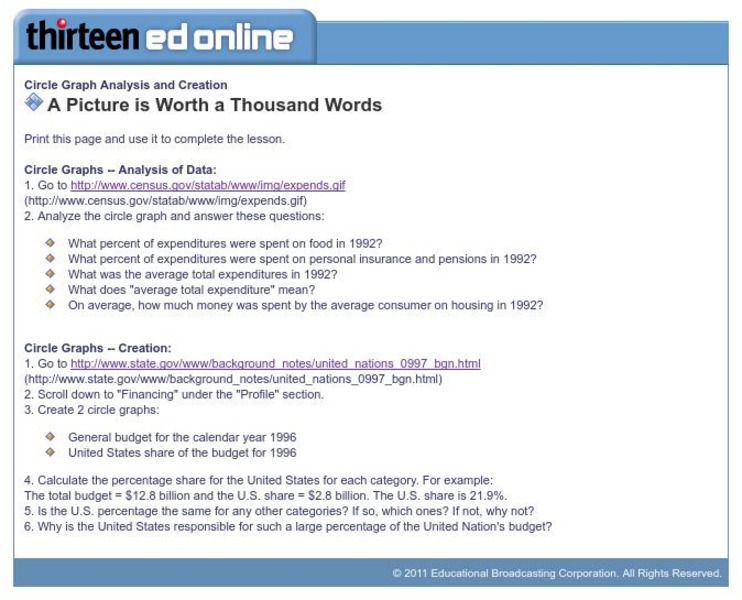
Wnet: Thirteen: Circle Graph Analysis and Creation
This site, which is provided for by WNET, gives a great way to practice using circle graphs through these exercises. One is analyzing a pie graph from the Census Bureau and the other creating pie charts using government data.


