Curated OER
Dialogue Tags/ Synonyms for Said
Sixth graders analyze dialogue tags. In this synonyms lesson students work in groups analyzing a personal narrative. They enter the words onto a classroom chart as well as their notes or journal. The students replace tags with more...
Curated OER
Box Plots on the TI-83 Calculator
Eighth graders research box plots on the Internet. They gather real life statistics and analyze the collected statistics by making multiple box plots on the TI-83 calculator.
Curated OER
Coordinates (3)
In this math instructional activity, students explore coordinate graphing by analyzing a graph which has points plotted on both positive and negative sides. Students locate the points indicated and write the ordered pairs. There are no...
Curated OER
Statistics
In this statistics instructional activity, students solve 2 problems that involving plotting data, recognizing ordered pairs, and analyzing the graphed relationship.
Curated OER
Confidence Levels
Students collect data and graph it. In this statistics lesson, students rate confidence levels by collecting data and analyzing it. They graph their findings on the Ti calculator.
Curated OER
Box-and-Whisker Plots
Students explore nutritional information for several fast food hamburgers using statistical applications. In this statistics lesson, students analyze calories, fat, and sodium content of various fast food restaurants. Students also...
Curated OER
Exercise Those Statistics!
Learners participate in various activities, measuring their pulse rates and recording the data. They analyze the statistical concepts of mean, median, mode, and histograms using the data from the cardiovascular activities.
Curated OER
Surveys and Samples
For this surveys and samples worksheet, students discover data collection techniques and write their own survey questions. Students use random sampling, convenience sampling, and systemic sampling and analyze their results.
Curated OER
Atlatl Lessons for Grade 4
Fourth graders explore the weapons of the Aboriginal people. In this fourth grade math lesson, 4th graders create charts, tables, or diagrams to represent patterns and relations. Students investigate which dart length has the best...
Curated OER
Cost analysis
For this Algebra I worksheet, 9th graders analyze a problem in which basic assumptions must be made about cost and demand for the product or item. Students use a graph to make predictions and determine the best price at which to sell an...
Curated OER
Cinco De Mayo
High schoolers make a graph identifying the immigration of Mexicans to the US. In this algebra lesson, students practice graphing as they review different trends in immigration over the past 100 years. They interpret and analyze their...
Curated OER
Social Studies: Analyzing Massachusetts Immigration
Students investigate immigration in Massachusetts during the 1990's. They research a series of questions pertaining to immigration, including their experiences, obstacles, and countries of origin. They graph the five most prevalent...
Curated OER
Graphing the West Corridor Data
Students engage in a lesson which introduces them to using graphical analysis of data to analyze flaws in a transit system's design. They evaluate factors such as ride time, wait time, and percentage of capacity used in a train. Student...
Curated OER
Statistics and Probablility
Statistics and Probability are all about collecting, organizing, and interpreting data. Young learners use previously collected data and construct a picture graph of the data on poster board. This stellar lesson should lead to...
Curated OER
Single Event Upsets in Aircraft Avionics
In this aircraft avionics activity, science fans read about the first unmanned air vehicle that collects data about the Earth and is subject to damage by cosmic ray showers. Pupils analyze two graphs of data showing the neutron flux vs....
Miami University
Chapter Nine Worksheet: Monopoly
Advanced economics pupils analyze a series of graphs, data sets, and profit scenarios all related to monopolies and marginal revenue. They read through the background information, complete a graph using the data provided, and justify...
Curated OER
Matrix Madness!!
Perform operations to add, subtract, multiply and divide matrices. Then solve problems with vectors using matrices. A three day lesson: Matrix Madness, Mystical Matrices, and Decode the Encode. The last lesson has prizes that the class...
Laying the Foundation
Box-and-Whisker Plots
Statistics is made approachable, and dare we say fun, in this activity on using box-and-whisker plots to analyze and compare data sets. Specific emphasis is placed on interpretations and explanations while graphing, and in using the...
CK-12 Foundation
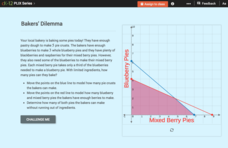
Linear Programming: Bakers' Dilemma
Place the pies in a line. Pupils create a graph of a system of linear inequalities to represent the number of pies a bakery can make. Learners analyze the vertices on the graph to determine the number of pies they can bake without...
CK-12 Foundation
Types of Data Representation: Baby Due Date Histogram
Histograms are likely to give birth to a variety of conclusions. Given the likelihood a woman is to give birth after a certain number of weeks, pupils create a histogram. The scholars use the histogram to analyze the data and answer...
EngageNY
Curves from Geometry
Escape to investigate hyperbolas. Pupils take a look at what happens to the elliptical orbital path of a satellite that exceeds escape velocity as the opener to the eighth lesson in a unit of 23. Scholars analyze basic hyperbolas and how...
Chymist
Pressure-Volume Relationships: Experiments with 140-mL Syringe
Learners examine Boyle's Law by analyzing experimental results with a hands-on lesson that provides a set of four experiments that illustrate the relationship between pressure and volume of gases. Groups analyze results using...
Curated OER
Budget Making
After analyzing a pie graph of national spending, high schoolers express their opinions on priorities for national spending. They create a new bar graph and mail it to their congressional representative with recommendations about needed...
Curated OER
Constitution/Impeachment/Reconstruction
Eleventh graders analyze a chart comparing U.S. census data from 1850, 1880, 1900, and 1920. They read a handout summarizing immigration legislation from 1882-1996 and create a graph charting how open / closed U.S. immigration is over time.
Other popular searches
- Analyzing Graphs Worksheets
- Analyzing Graphs Science
- Analyzing Graphs Math
- Analyzing Graphs Charts
- Making and Analyzing Graphs


