Rice University
Rice University: Cynthia Lanius: Let's Graph
An introduction to bar graphs, both vertical and horizontal in nature. The interactive aspect of this site allows students to change the values of the data - their favorite cafeteria foods - and then see how the graph is changed.
US Department of Education
Helping Your Child Learn Math: Math in the Home
An excellent compilation of activities that engage parents and children in math explorations at home. Detailed lessons covering a wide range of math topics such as fractions, measurements, money, data collection, and math in newspapers....
National Center for Ecological Analysis and Synthesis, University of California Santa Barbara
Nceas: What Are Data?
This site from NCEAS answers many questions about data. You can also learn about data, tables, and types of graphs in this informative site.
PBS
Pbs: The Lowdown: Made in America: The High Cost of Fashion
Investigate data on changes over time in where our apparel is made and how much we spend on it in these images from KQED. In the accompanying classroom activity, students use the interactive and graph the data. They also look for...
Other
Delta State University: Lesson Plan 3: Pie Graphs
The students will gather, organize, and display data in an appropriate pie (circle) graph using M&M's! [PDF]
Utah Education Network
Uen: 1st Grade Act. 04: Chrysanthemum and Letter Tiles
In this lesson, learners will engage in shared reading with the Kevin Henkes' book, Chrysanthemum. Then students will engage in a letter tiles activity that requires them to compare the length of their own names with the name...
PBS
Pbs: The Lowdown: u.s. Gun Homicides: Visualizing the Numbers
Explore firearm deaths in the United States in 2010 by type, race, and age group in this interactive from KQED. In the accompanying classroom activity, students are presented with a simple question: Is America a safe place to live? In...
English Zone
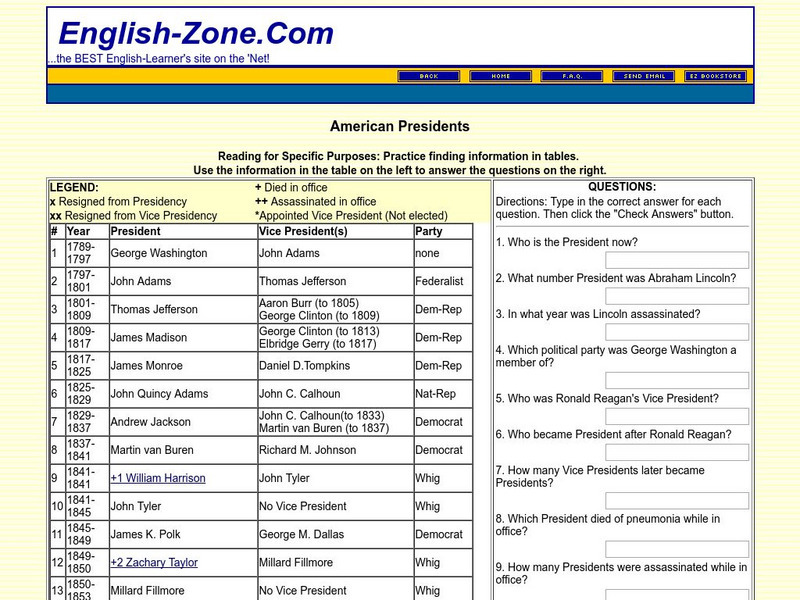
English Zone: American Presidents: Reading for a Specific Purpose
In this activity, information about American presidents is provided in chart format on the left and asks students to use the chart to answer the questions on the right. Note: the last president listed is George W. Bush. Java is required.
Illustrative Mathematics
Illustrative Mathematics: Color Week
Five-year-olds need to count things that relate to them. This activity builds on their need to be included or see the relevance of their counting. Students will practice counting, writing numbers, and filling in a chart or bar graph....


