Hi, what do you want to do?
Curated OER
Cinderbank
Fourth graders identify major components of a "Cinderella" story in order to create a database.
Curated OER
Different Perspectives of Oregon's Forest Economic Geography
Students locate the many forests located in Oregon. In groups, they use the internet to research employment data on wood products made in the state. They discuss how looking at information presented in a different way can change their...
Curated OER
Huck Finn Chapter Questions
Pupils answer chapter questions to evaluate the novel, The Adventures of Huckleberry Finn.
Curated OER
Is Charleston Your Lucky Charm?
Students determine what makes Charleston, West Virginia unique. In this West Virginia history lesson, students explore the West Virginia History Museum to identify why Charleston became the capitol of the state.
Curated OER
Wolves
Young scholars utilize several different sources to research wolves, after completing the K-W-L process.
Curated OER
The Research Paper - Searching for a Subject
Pupils research a website to look for potential topics for a research paper. They develop a narrowed prioritized subject list on an index card (3X5) using word processing program.
Curated OER
Weather Wonderland
Second graders explore the types of tools that scientists use t o study weater,
Curated OER
JEPSON PRAIRIE RESERVE RESEARCH PROJECT
Students research a field question of their choosing.
Curated OER
Watershed Management
Students investigate the concept of a watershed. They conduct research into the concept using a variety of resources. Students take a field trip to a local watershed to make observations. The outcome is a report concerning the outside...
Utah Education Network
Uen: Balanced Diet
In this lesson plan, 2nd graders will learn about the components of a balanced diet. Students will analyze charts and then self-report their own foods in categories. Several fiction and nonfiction books are listed as additional resources.
Texas Education Agency
Texas Gateway: Analyze Graphical Sources: Practice 2 (English I Reading)
This lesson focuses on practice exercises to understand and interpret the data in a graphic representations including pie charts, bar graphs, and line graphs.
Scholastic
Scholastic: Bars, Lines, and Pies
Students will learn and reinforce skills for creating, applying and analyzing pie charts, bar graphs and line graphs.
Texas Education Agency
Texas Gateway: Analyze Graphical Sources: Practice 2 (English Ii Reading)
[Accessible by TX Educators. Free Registration/Login Required] Analyze the factual, quantitative, and technical data in graphs and charts.
Utah Education Network
Uen: Familiarizing Students With the 5 Food Groups
This module provides a multiple-day unit about the five food groups. Teachers of the unit will explicitly teach students about analyzing charts. Then students will gain exposure with written and visual resources to help apply the...
Better Lesson
Better Lesson: Circle Graph Activity
This lesson will allow the student to work through three stations. The stations will focus on creating and analyzing circle graphs. The students will be using technology to create their graphs along with a hands-on activity using M&M's.
Texas Education Agency
Texas Gateway: Analyze Graphical Sources: Practice 2 (English I Reading)
You will look at each of these types of graphs: bar graph, line graph, pie charts, as you work your way through the lesson.
Better Lesson
Better Lesson: Circle Graph Activity
This lesson will allow the student to work through three stations. The stations will focus on creating and analyzing circle graphs. The students will be using technology to create their graphs along with a hands on activity using M &...
Oswego City School District
Regents Exam Prep Center: Practice With Organizing and Interpreting Data
Several problems are presented to test your skills in creating and interpreting frequency tables, pie charts, box-and-whisker and stem-and-leaf plots.
ClassFlow
Class Flow: Charts Handling Data
[Free Registration/Login Required] Reading graphs fit together with this engaging, colorful flipchart analyzing pie charts, bar graph, percents, and fractions.
Texas Education Agency
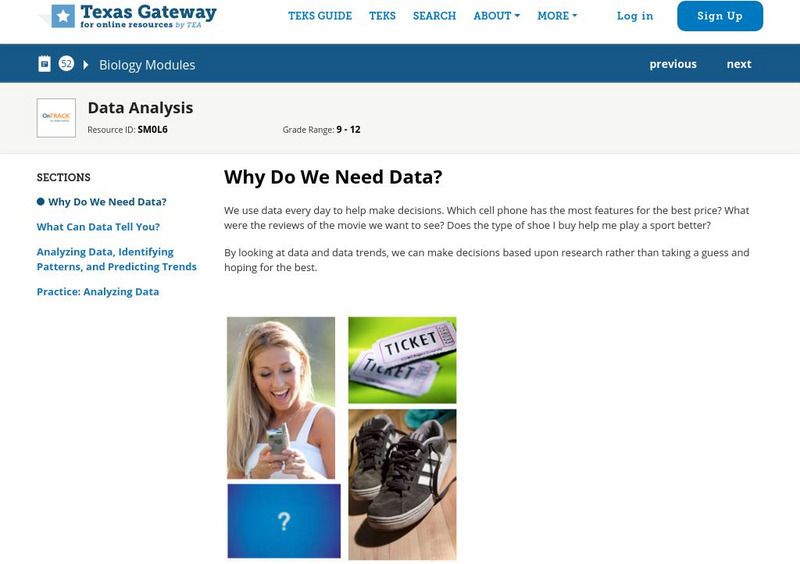
Texas Gateway: Data Analysis
Given laboratory investigation data in the form of tables, charts, and graphs, students will analyze and predict trends from the data.
Khan Academy
Khan Academy: Reading Dot Plots & Frequency Tables
Practice reading basic dot plots and frequency tables. Students receive immediate feedback and have the opportunity to try questions repeatedly, watch a video or receive hints.
Other
Tulpehocken Area School District: Graphing and Analyzing Scientific Data
Student worksheet with explanation of pie, bar, and line graphs, the parts of a graph, and the definition of mean, median, and mode. This summary is followed by an exercise for each type of graph within a scientific context.
Better Lesson
Better Lesson: Analyzing and Creating Circle Graphs
Sixth graders will be learning through exploration on how to analyze and create circle graphs and Venn diagrams.
Texas Education Agency
Texas Gateway: Analyzing Two Dimensional Motion
Given descriptions, illustrations, graphs, charts, or equations, students will analyze motion in two dimensions, including projectile and circular motion.


