NOAA
Mapping the Deep-Ocean Floor
How do you create a map of the ocean floor without getting wet? Middle school oceanographers discover the process of bathymetric mapping in the third installment in a five-part series of lessons designed for seventh and eighth graders....
Curated OER
A world of oil
High schoolers practice in analyzing spatial data in maps and graphic presentations while studying the distribution of fossil fuel resources. They study, analyze, and map the distribution of fossil fuels on blank maps. Students discuss...
Curated OER
Chart Making for Navigators
Students discuss the importance and function of nautical maps for sailors. They, in groups, take soundings of a simulated bay in a shoebox and develop a nautical chart that enable them to navigate the shoebox safely.
Curated OER
Mapping The Ocean Floor
Young scholars explore and analyze the bottom structure of underwater habitats. They describe and explain what can't see through the collection and correlation of accurate data. Learners assess that technology is utilized as a tool for...
Curated OER
From Restriction Maps to Cladograms
Biology aces analyze restriction maps to determine the relationships among different primate species and then complete a cladogram. Preface this instructional activity with an explanation of how restriction enzymes are used to create the...
Polar Trec
Global Snow Cover Changes
Snow is actually translucent, reflecting light off its surface which creates its white appearance. Pairs or individuals access the given website and answer questions about snow cover. They analyze graphs and charts, examine data, and...
Curated OER
Principles of Flight: Where are We?
Students explore the concept of topographical maps. In this topographical map lesson, students discuss how airplanes know where to fly. Students use topographical maps to simulate a field trip on the computer.
Curated OER
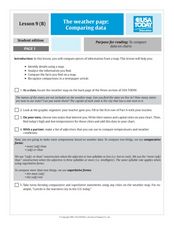
The Weather Page-Comparing Data
Students examine weather patterns in the United States. In this weather lesson, students use a United States map to identify high and low temperatures in two states. Students compare the data and record their findings onto a chart.
Curated OER
Exploring an Atlas
Students explore global geography by participating in an atlas activity. In this countries of the world lesson, students collaborate in small groups and analyze an atlas while researching continents, countries and demographics. Students...
Curated OER
Storm Clouds-- Fly over a Late Winter Storm onboard a NASA Earth Observing Satellite
Students study cloud data and weather maps to explore cloud activity. In this cloud data lesson plan students locate latitude and longitude coordinates and determine cloud cover percentages.
Chicago Botanic Garden
Recent Weather Patterns
Decide whether weather is changing! A two-part activity first challenges classes to review the differences between weather and climate. Once finished, individuals then analyze historical data to determine if climate change is happening...
Curated OER
Snow Cover By Latitude
Students create graphs comparing the amount of snow cover along selected latitudes using data sets from a NASA website. They create a spreadsheet and a bar graph on the computer, and analyze the data.
Curated OER
Landscape Diversity in the Yukon Territory
Students review and analyze a satellite image of the Yukon territory.
Curated OER
Where Has It Been? Tracking the Ivory-Billed Woodpecker
By studying the assumed extinction, and subsequent rediscovery of the Ivory-billed Woodpecker, learners use maps and come up with a scenario for the rediscovery of the bird. This incredibly thorough lesson plan is chock-full of...
Curated OER
Studying Snow and Ice Changes
Students compare the change in snow and ice over a 10 year period. In this environmental science lesson, students use the live data on the NASA site to study and compare the monthly snow and ice amounts on a map of the entire...
Curated OER
Tables, Charts and Graphs
Students examine a science journal to develop an understanding of graphs in science. In this data analysis lesson plan, students read an article from the Natural Inquirer and discuss the meaning of the included graph....
Curated OER
Hurricanes
Students research the formation and life-span of hurricanes and, after analyzing statistics, try their hand at plotting and predicting the course a hurricane.
Texas State University
Earth: Deposition and Lithification
Geology geniuses analyze sediment samples with a hand lens and sort according to physical characteristics. They also learn about the processes of cementation, compaction, and lithification within the rock cycle. The lesson plan is...
Curated OER
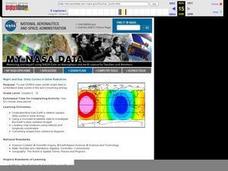
NIGHT AND DAY: DAILY CYCLES IN SOLAR RADIATION
Students examine how Earth's rotation causes daily cycles in solar energy using a microset of satellite data to investigate the Earth's daily radiation budget and locating map locations using latitude and longitude coordinates.
Curated OER
What Factors Contribute In Attracting Birds To Feeders?
Students develop their own research questions dealing with specific variables provided by the instructor; students conduct bird counts using two kinds of birdseed, and analyze possible effects such as abundance or diversity.
Curated OER
A Research Project and Article For the Natural Inquirer
Get your class to use the scientific process to solve a scientific problem. They utilize the Natural Inquirer magazine to identify a research question which they write an introduction to and collect data to answer. They use graphs,...
Curated OER
Urban Planning: Plan a City
Students analyze the concept of urbanization by planning the placement of some of the major urban/suburban features that make up most cities. They arrange the cultural features to benefit the people who live there, and maintain respect...
Curated OER
Latitude
Students examine the theory of finding latitude and discuss the uses of an astrolabe, cross-staff and octant. They determine an Astronomical Table for their classroom.
Curated OER
Creating and Analyzing Graphs of Tropospheric Ozone
Students create and analyze graphs using archived atmospheric data to compare the ozone levels of selected regions around the world.


