Curated OER
Investigation - Looking For Triangles
Seventh graders investigate a series of triangles, looking for patterns and generalizing what they have found. They analyze the pattern data and organize it into a table and graph. Students identify the relationship and discover the rule...
Pennsylvania Department of Education
The Multiplicative Identity and Numbers Close to One
Pupils practice multiplying and dividing whole numbers by fractions. They study the multiplicative identity property that states that the product of any number and 1 is that number. They multiply whole numbers by fractions close to 1 and...
Illustrative Mathematics
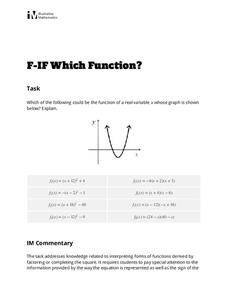
Which Function?
Learners are given a graph of a parabola on a coordinate system, but intercepts and vertex are not labeled. The task is to analyze eight given quadratic functions and determine which ones might possibly be represented by the graph. The...
Curated OER
Quadratic Equation - Part I
Using a graphing calculator, construct a graph and find solutions to quadratic equations. Observe additional methods of solving quadratic equations. Independently, solve solutions by using the discriminant.
Curated OER
Plugging Into The Best Price
Examine data and graph solutions on a coordinate plane with this algebra lesson. Young problem-solvers identify the effect of the slope on the steepness of the line. They use the TI to graph and analyze linear equations.
Curated OER
Endangered Species
Ninth graders graph data in order to compare the number of extinct species and a rise in human population. They analyze the data collected. Students are encouraged to infer the relationship.
Curated OER
Rain Forests: A Disappearing Act?
Students examine and locate rainforests on maps, and research the patterns of their destruction. They develop a bar graph of rainfall and temperature data, write a journal entry, and research the people, animals, and plants/products of...
Curated OER
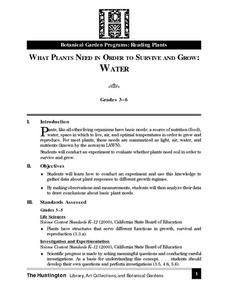
What Plants Need in Order to Survive and Grow: Water
Students conduct an experiment to evaluate whether plants need water to survive and grow. They observe two cactus plants for four weeks, analyzing the results of one plant having received water and the other having received no water.
Curated OER
Worksheet 33 - Integrals
In this integral worksheet, students analyze equations using the gamma function. They sketch graphs of functions, and find the are between the graph and the x-axis. This two-page worksheet contains five multi-step equations.
Curated OER
Polynomials Functions
High schoolers factor polynomials and linear functions and apply concepts of the fundamental theorem of algebra to solve problems. They graph their solutions and analyze the graph.
Curated OER
Modeling Linear Relationships
Students graph lines using the slope and y-intercept. In this algebra lesson, students create data using tables and equations. They use their data to make predictions and draw conclusion.
Curated OER
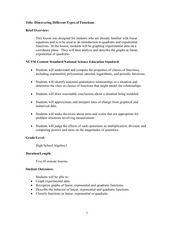
Discovering Different Types of Functions
Graph polynomials and identify the end behavior of each polynomial function. The class differentiates between linear, quadratic, and other polynomial equations.
Curated OER
Creating Climographs
Students chart statistical information on graphs, interpret the information and use it to explain spatial relationships, and identify the relationship between climate and vegetation.
Curated OER
Maximize It!
Students design a rectangular box without a lid that has the largest possible volume using the supplied sheet of centimeter graph paper. They work in groups to construct different size boxes to determine the largest possible volume and...
Curated OER
Exploring Exponential Growth and Decay Functions
Students differentiate between exponential growth and decay. In this algebra lesson plan, students solve exponential equations using properties of exponents. They use the Ti calculator to graph and analyze their functions.
Curated OER
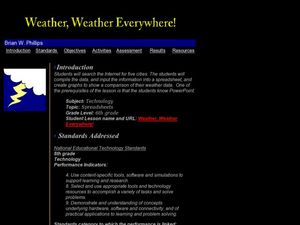
Weather, Weather, Everywhere!
Sixth graders collect weather data to compare temperatures around the world. Using the Internet, learners collect data, put it into spreadsheets, and analyze and graph the results. An interesting way to cover the topic of weather.
Curated OER
School Yard Waste
Fourth graders examine the types of garbage that they collect on the playground. They collect the information in a spreadsheet and create a graph that displays the number of types of trash found. They design and monitor a playground...
WK Kellogg Biological Station
Plotting Phenology
Finally, a worksheet that involves more than filling in some blanks. Your budding ecologists must graph and analyze three sets of data, then synthesize the information as they think about the impacts of plant reproduction on insects and...
Curated OER
Land Use Unit
Students identify factors in human society and the natural environment aree interdependent. They analyze interdependencies demonstrated in various situations and occurances.
Curated OER
Theobroma - Food of the Gods
Learners discuss the history of cacao and its use in the production of chocolate. They analyze actual cacao pods and record their observations. Finally they create a five minute contour drawing of the cacao pod and seeds.
Curated OER
Stick-Slip Movement
Ninth graders operate a model to observe the type of motion that occurs at a fault during an earthquake. They explore the effects of several variables. Students measure movement, calculate averages and plot and graph information.
Curated OER
Height versus Shoe Size
Students find a correlation between a person's height and his/her shoe size. They have access to entering data into lists on a graphing calculator and can complete scatter plots. Students read and interpret a scatter plot and use the...
Curated OER
Old Glory
Students utilize mathematical concepts such as: measurement, ratio and proportion and geometric probability to analyze the components of the U.S. Flag. They collect, organize and interpret data by constructing charts, tables and graphs...
Curated OER
Exploring the Normal Curve Family
Students find different characteristics of the bell curve. In this statistics lesson, students analyze a family for a specific characteristic. They identify the shape, center, spread and area as they analyze the characteristic of the...


