Curated OER
Box Plots on the TI-83 Calculator
Eighth graders research box plots on the Internet. They gather real life statistics and analyze the collected statistics by making multiple box plots on the TI-83 calculator.
Teach Engineering
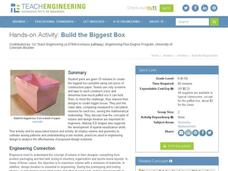
Build the Biggest Box
Boxing takes on a whole new meaning! The second installment of the three-part series has groups create lidless boxes from construction paper that can hold the most rice. After testing out their constructions, they build a new box....
Curated OER
Stem-and-Leaf Plots
Students are introduced to stem-and-leaf plots and calculating the mean, median, and mode from the plots.
Curated OER
Capturing the Wind
Students collect and analyze data about wind speed. They build a Lego wind sail and measure the wind speed with a rotation sensor. They use software to analyze the data.
Rochester Institue of Technology
Ergonomic Design
To an engineer, the glass is never half full; it's just double the necessary size. The fifth installment of a nine-part technology and engineering series teaches pupils about the idea of ergonomic design. Measurements of popliteal height...
Curated OER
Ornithology and Real World Science
Double click that mouse because you just found an amazing lesson plan! This cross-curricular Ornithology lesson plan incorporates literature, writing, reading informational text, data collection, scientific inquiry, Internet research,...
Curated OER
Rotation Sensor Challenge
Young scholars participate in a challenge to construct a rotation sensor with the highest degree of accuracy and repeatability. They conduct computer analysis of their sensor using repeated trial.
Curated OER
Statistics Newscast in Math Class
Young scholars study sports teams, gather data about the teams, and create a newscast about their data. For this sports analysis lesson, students research two teams and define their statistical data. Young scholars compare the two teams,...


