Curated OER
Slope of a Function
Seventh graders explore the concept of the slope of a line. They see how to determine the direction of the line. Also students are introduced to the slope intercept algebraic expression in conjunction with the rise/run.
Curated OER
Graphing System of Equations
Students solve system of equation. In this algebra lesson, students graph, substitute and eliminate to solve system of equation. They identify the point of intersection and how many solution each system will have.
Curated OER
Linear Equations
In this Algebra II activity, 11th graders write the equation of a line given a table, the slope and a point, or two points. The three page activity contains eleven problems. Answers are not provided.
Curated OER
Graphing Linear Equations with Calculator
Students graph lines using the calculator. In this algebra lesson, students graph lines of equations in the form y=mx+b. They input equations into the TI Calculator and graph using the slope and intercept. They analyze the graph for...
Curated OER
Properties of a Parabola
In this algebra learning exercise, students identify the properties of a parabola. They factor and graph quadratic equations. There are 18 questions.
Curated OER
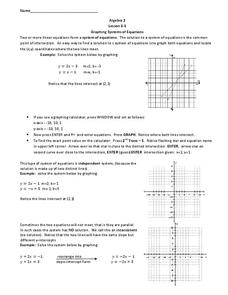
Graphing Systems of Equations
In this Algebra II worksheet, 11th graders use graphing to determine the solution to a system of linear equations. The two page worksheet contains explanation and three guided problems. Answers are not included.
Curated OER
Properties of Logarithms
Students explore the concept of logarithms. In this logarithms activity, students graph logarithms on their Ti-Nspire calculator. Students describe the shapes of their graphs by identifying slope, y-intercepts, and...
Curated OER
Eighty-Six Various Polynomial Function Problems
In this polynomial functions worksheet, students solve eight-six various problems concerned with the degree, graph, intercepts, end behavior, and transformations of polynomial functions. Some of the problems are algebraic work and some...
Curated OER
Rational Functions
In this Algebra II/Pre-calculus worksheet, students solve and graph rational equations, identifying the intercepts and asymptotes. The six page worksheet contains nine problems. Answers are not provided.
Curated OER
Math Honors 2: Trigonometry Review Questions
In this Algebra II/Trigonometry worksheet, students solve problems involving angle of depression or elevation, evaluate trigonometric expressions, solve trigonometric equations, and graph trigonometric functions. The one page worksheet...
Curated OER
Composition of Functions
Students solve problems using the composition of functions. For this algebra lesson, students analyze the graph of a quadratic equation for its vertex and intercepts. they find the inverse of the function using addition, subtraction,...
Curated OER
Two Variable Inequalities
For this algebra worksheet, students solve inequalities using addition, subtractions and multiplication. They graph the inequalities with shading. There are 2 questions.
Curated OER
Proportionality in Tables, Graphs, and Equations
Students create different methods to analyze their data. In this algebra instructional activity, students differentiate between proportion and non-proportional graph. They use the TI-Navigator to create the graphs and move them around to...
Curated OER
What's Its Slope
Students identify the slope of a lines.In this algebra lesson, students define the meaning of slope and write an equation given the slope. They graph linear functions using the slope and y-intercept.
West Contra Costa Unified School District
Discovering Slope of a Line in Standard Form
From start to finish this skills practice resource provides a way for individuals to explore the standard form equation of a line. Begin with a warm-up, work through the problems, and then discover the relationship between the...
Curated OER
Worksheet 7, Polynomials
In this algebra worksheet, learners graph 3 polynomial functions. They find the intercepts, and the intervals above the x axis. Students create their own polynomials with given characteristics.
Curated OER
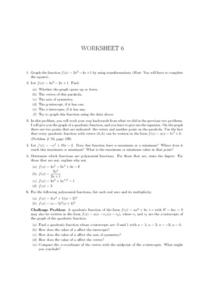
Worksheet 6, Graphing Functions
In this algebra worksheet students graph a given function by completing the square. They analyze a function and tell the axis of symmetry, the intercepts, and vertex. Students identify the maximum or minimum of a graph. Students identify...
Curated OER
Quadratic Equation Calculator
In this Algebra II worksheet, 11th graders use an online quadratic equation solver to find the zeros of a quadratic. The one page interactive worksheet provides one worked example and the equation solver.
Curated OER
Graphing Review
Students review the principles of graphing linear functions. They discuss plotting points on a coordinate plane, solving using a table, and then graphing. Students solve problems and determine the slope of the line, y-intercept and if...
Curated OER
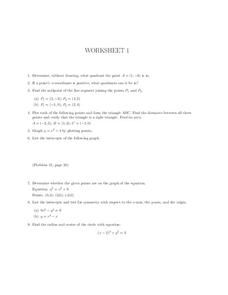
Worksheet 1, Coordinate Graphing
In this algebra worksheet, students determine the quadrant a given point is in. They find the midpoints of two line segments. Students plot points to form a triangle and find the distance between points. Students find the area of the...
West Contra Costa Unified School District
Graphing Systems
Get hands on with solving systems of equations graphically. A solid lesson plan uses guided practice to show how to solve systems of linear equations. It allows time for sharing ideas and provides a printable matching activity...
West Contra Costa Unified School District
Shifting Linear Equations in Function Notation
Time for a shift in thinking! Learners examine translations of linear functions. They use function notation to describe the translation and make connections to the graph.
West Contra Costa Unified School District
Families of Functions Sort
Have some fun with functions with a short activity that asks learners to first sort scatter plot in terms of their correlation. They then sort graphs of different types of functions in terms of key features, such as slope.
Curated OER
Off to College
High schoolers investigate linear, quadratic and exponential equations using the TI calculator. They identify relation and functions using ordered pairs, graph the data, analyze the data, and relate it to real-world situations.


