Texas Instruments
TI-Nspire™ CAS
When it comes to rating educational calculators, this calculator is always near the top of this list. Now it's available as an app. There is a lot of calculator power wrapped up in this app. Not only is this a fully functioning...
EngageNY
Equivalent Rational Expressions
Rational expressions are just fancy fractions! Pupils apply fractions concepts to rational expressions. They find equivalent expressions by simplifying rational expressions using factoring. They include limits to the domain of the...
EngageNY
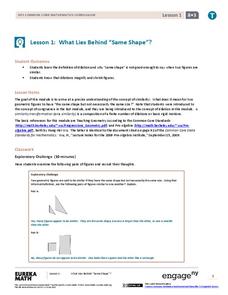
What Lies Behind “Same Shape”?
Develop a more precise definition of similar. The lesson begins with an informal definition of similar figures and develops the need to be more precise. The class learns about dilations and uses that knowledge to arrive at a mathematical...
EngageNY
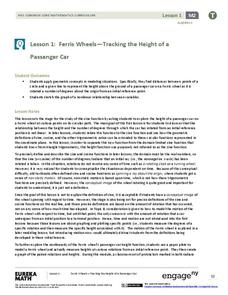
Ferris Wheels—Tracking the Height of a Passenger Car
Watch your pupils go round and round as they explore periodic behavior. Learners graph the height of a Ferris wheel over time. They repeat the process with Ferris wheels of different diameters.
Georgia Department of Education
Math Class
Young analysts use real (provided) data from a class's test scores to practice using statistical tools. Not only do learners calculate measures of center and spread (including mean, median, deviation, and IQ range), but also use this...
Curated OER
Is Bigger Always Better?
Explore rational numbers with the young mathematicians in your class. They will investigate decimals, fractions, and percents before ordering and comparing rational numbers. This multi-day unit includes differentiation activities and...
Curated OER
Pumped Up Gas Prices
Students calculate gas prices. In this transportation lesson, students tally the mileage and gas costs of their car for one months. They figure out how much was spent on gas and create a graph showing average gas prices over time.
Curated OER
Mathematical Magazines
Students classify and tabulate the type of advertisements found in a collection of magazines. Determination is made on what percent of the total number of ads each type represents. They present their results orally and in a graph.
Curated OER
Mini-Metric Olympics
Eighth graders participate in the mini-metric Olympics. In this measurement lesson, 8th graders solve real-world problems that require them to calculate length, area, and volume in metric units.
Curated OER
Four Fours Challenge
Second graders look at the number patterns created when tins are stacked in different arrangements. The aim of the unit is for students to keep track of the numbers involved by drawing up a table of values. They are then encouraged to...
Curated OER
Ohio Census 1990 & 2000
Students use Ohio census data to solve problems, make comparisons, draw conclusions, and support predictions related to Ohio's population. They interpret and work with pictures, numbers and symbolic information.
Curated OER
Energy Choices
Students add and multiply decimals to complete gas choice worksheets. They discover which gas supplier has the best gas prices. Students collect and interpret data about local natural gas suppliers and use this information...
Curated OER
Drip, Drip, Drip
Students gather scientific data and be able to utilize the data to generalize results over a long period of time. They use the appropriate tools to measure quanities of liquids and analyze the data to determine the cost of a leaky faucet.


