Curated OER
Linear Regression and Correlation
Learners explore scatter plots. In this linear regression lesson, groups of pupils graph scatter plots and then find the line of best fit. They identify outliers and explain the correlation. Each group summarizes and shares their...
Curated OER
Using Excel to Reference and Graph Live Data from a Web Site
Students collect live buoy data about water temperatures in the Gulf of Mexico from the Internet and work individually to organize their data and create a line graph using Excel Spreadsheet. Students analyze their data and examine any...
Curated OER
Graphing Inequalities in Two Variables
This study guide is a great resource to help you present the steps to graphing linear inequalities. Show your class two different ways to graph an inequality and work on a real-world example together. The document could also be easily...
Inside Mathematics
Squares and Circles
It's all about lines when going around. Pupils graph the relationship between the length of a side of a square and its perimeter. Class members explain the origin in context of the side length and perimeter. They compare the graph to the...
Curated OER
Graphing on the Coordinate Plane
In this geometry activity, 10th graders determine the midpoint of a line segment given the coordinates of the two endpoints or find the missing endpoint given the coordinates of the midpoint and one endpoint. The one page activity...
Curated OER
Chart Your Course
Students explore change represented in graphs comparing distance and time. They exchange and share their graphs. Students interpret and create distance versus time line-graphs, and write stories based on these graphs. They interpret a...
Curated OER
Linear Graphs and Patterns
Fifth graders find pairs of whole number co-ordinates and use them to draw graphs in problem contexts. They find and interpret the all meaningful pairs of whole number co-ordinates from graphs.
Curated OER
Interpreting and Displaying Sets of Data
Students explore the concept of interpreting data. In this interpreting data lesson, students make a line plot of themselves according to the number of cubes they can hold in their hand. Students create their own data to graph and...
Inside Mathematics
Population
Population density, it is not all that it is plotted to be. Pupils analyze a scatter plot of population versus area for some of the states in the US. The class members respond to eight questions about the graph, specific points and...
Mathematics Vision Project
Module 3: Arithmetic and Geometric Sequences
Natural human interest in patterns and algebraic study of function notation are linked in this introductory unit on the properties of sequences. Once presented with a pattern or situation, the class works through how to justify...
Curated OER
Linear Patterns in Data
Eighth graders extend their learning of graphing linear equations and are introduced to connecting patterns in tables and graphs to represent algebraic representations. They then determine patterns and extrapolate information from these...
Curated OER
Reading Graphs
Students practice plotting functions on the Cartesian coordinate plane, see several categories of functions, including lines and parabolas, and read a graph, answering questions about the situation described by the graph
Curated OER
Mathematics Witing: Algebraic Processes and Its Connections to Geometry
Students, using manipulatives, determine how many different ways there are to arrange 3 and 4 objects. They organize and record their arrangements. Students investigate the pattern generated by 3 and 4 objects, they predict how many ways...
Curated OER
Line of Best Fit
Students explore the concept of linear regression. In this linear regression lesson, students do a Barbie bungee activity where they collect linear data. Students plot their data using a scatter plot. Students determine a line of best...
Curated OER
Scattered About
Middle schoolers are introduced to the concept of scatter plots after reviewing the various types of graphs. In groups, they analyze the type of information one can receive from a scatter plot and identify the relationship between the x...
Willow Tree
Linear Relationships
There's just something special about lines in algebra. Introduce your classes to linear equations by analyzing the linear relationship. Young mathematicians use input/output pairs to determine the slope and the slope-intercept formula to...
Ms. Amber Nakamura's Mathematics Website
Algebra Project
What would your dream house look like? A cottage? A medieval castle? High schoolers enrolled in Algebra design the perfect house while using slopes to write equations for various aspects of the project.
Curated OER
Geometry: Parallel and Perpendicular Lines
This basic handout would be good for skills practice or a review of parallel and perpendicular lines. Review the definitions, then practice writing equations of lines that pass through a specific point and are either parallel or...
Curated OER
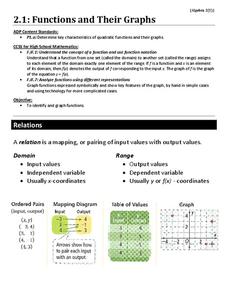
Functions and Their Graphs
Use a worksheet to go over the basic concepts of relations and functions. Included are clear definitions and examples of relations, domain and range, and functions and the vertical line test. However, the problems are pretty basic. A...
EngageNY
Analyzing Residuals (Part 2)
Learn about patterns in residual plots with an informative math lesson. Two examples make connections between the appearance of a residual plot and whether a linear model is the best model apparent. The problem set and exit ticket...
West Contra Costa Unified School District
Sneaking Up on Slope
Pupils determine the pattern in collinear points in order to determine the next point in a sequence. Using the definition of slope, they practice using the slope formula, and finish the activity with three different ways to determine the...
EngageNY
Comparing Linear and Exponential Models Again
Making connections between a function, table, graph, and context is an essential skill in mathematics. Focused on comparing linear and exponential relationships in all these aspects, this resource equips pupils to recognize and interpret...
Curated OER
Which Car Should I Buy?
Students use gas mileage of different cars to create T charts, algebraic equations, and graphs to show which gets better mileage. In this gas mileage lesson plan, students use the graph to see which car they should buy.
Curated OER
Slope of Line
In this algebra worksheet, students calculate the slope of a line. They graph a linear equation given the slope and y-intercept and identify the slope and y-intercept given a linear graph. There are 15 questions.


