Curated OER
Transformations of Functions 1
Learn how to solve problems with transformation. Students perform transformation on their graphs. Then, they use the TI to create a visual of the graph as it is moving along the graph.
Curated OER
Transformations of Functions 2
Solving problems on the TI graphing calculator can be quite easy. Students observe the properties of transformation of functions and create a formula for the transformation.
Curated OER
Variables and Open Sentences
Fourth graders examine the purpose of variables and identify the missing variable in open sentences. They observe the teacher solve a variety of problems, complete a worksheet as a class, and independently complete another worksheet. ...
Curated OER
Balancing Equations and Using a Pyramid
Sixth graders complete worksheets and make journal entries to interpret mathematical expressions about the pyramids. In this equality by balancing equations lesson, 6th graders participate in groups or by themselves to complete exercises...
Curated OER
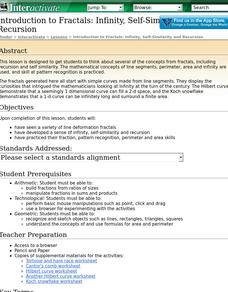
Introduction to Fractals: Infinity, Self-Similarity and Recursion.
This lesson introduces students to the ideas involved in understanding fractals. They develop a sense of infinity, self-similarity and recursion and
Curated OER
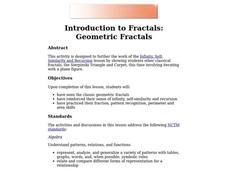
Introduction to Fractals: Geometric Fractals
Students study and observe the patterns made by the areas of the Sierpinski Triangle. Students use the computer to draw two or three iterations to discover the number patterns. Students complete worksheets based on Geometric Fractals.
Curated OER
Geometric Fractals and the Chaos Game
Learners define fractals and patterns. They explore how a seemingly random process can result in a pattern. Students practice probability and fractions skills by playing the chaos game online.
Curated OER
Impedance Matching with Transformers
In this electrical circuit worksheet, students answer a series of 19 questions by analyzing schematics dealing with the transformers. Students will determine the amount of impedance to various scenarios.
Curated OER
Build a Skittles Graph
Students construct a bar graph with a given set of data. They calculate the ratio and percent of the data. Students discuss alternate ways of graphing the data as well as multiple strategies to approach the task.
Curated OER
Shop 'Til You Drop
Students compare food prices to find the lowest unit price and make choices about where to shop and what to purchase on weekly items, cost comparisons and items needed. They collect grocery ads and weekly sale flyer's to expedite their...
Curated OER
Simplify expressions and Combine Like Terms
Students will use the distributive property to simply expressions by removing parentheses from the expression. Like terms will then be combined to completely simplify the expression.
Curated OER
What Are My Chances?
Students calculate probability. In this instructional activity on probability, students use given data to calculate to chances of a given event occurring. Many of the calculations in this instructional activity are applicable to daily life.
Curated OER
Doorbell Division
Students explore the concept of division using the book "When the Doorbell Rang." They listen to the book, role-play the dividing of the cookies from the story, and create their own story problem to solve using the stamp program from...
Curated OER
Make a Pass at Me
Young scholars identify different types of functions and units of measurements. In this statistics instructional activity, students will collect data, graph their data and make predictions about their data. They plot a linear...
Curated OER
Unequal Groups vs. Equal Groups
Third graders read and discuss math story problems and analyze if the story is using equal groups or unequal groups. They listen to the book "12 Ways To Get to 11," and simulate the story using beads on a pipe cleaner. Students then...
Curated OER
Arithmetic: Fractions
For this fractions instructional activity, learners add positive and negative fractions with unlike denominators. They compute a fractional part of a number. This six-page instructional activity contains approximately 20 problems....
Curated OER
Pumped Up Gas Prices
Students calculate gas prices. In this transportation lesson, students tally the mileage and gas costs of their car for one months. They figure out how much was spent on gas and create a graph showing average gas prices over time.
Curated OER
Build A Skittles Graph
Students explore graphing. In this graphing activity, students sort Skittles candies and use the color groups to create a bar graph. Rubrics and extension activities are provided.
Curated OER
Global Statistics
Students determine statistics based on data. In this statistics lesson plan, students use data and record in charts. Students create graphs based on the statistics found.
Curated OER
Let's Go Shopping: Estimation At The Mall
Students estimate the total cost of a shopping trip. In this estimation lesson, students use three different techniques to estimate how much a shopping trip will cost.
Curated OER
Simplify Expression Using the Order of Operations
Allow learners to explore both the right and wrong way of completing equations with the order of operations. They discuss how the order in which operations are performed affects the outcome of a problem. A fun "trick" using order of...
Curated OER
Exploring Equations and Y-Intercept
Students graph linear equations using intercepts, find y-intercept, find x-intercepts and graph linear equations that use horizontal and vertical lines.
Curated OER
Graphing and the Coordinate Plane
Students learn about the Cartesian coordinate plane, understand the four quadrants of the Cartesian coordinate plane, and plot points on the plane. Students read coordinates for a point from a graph and give the ratio of rise over run...
Curated OER
Reading Graphs
Students practice plotting functions on the Cartesian coordinate plane, see several categories of functions, including lines and parabolas, and read a graph, answering questions about the situation described by the graph


