Curated OER
Cartesian Coordinate System
Students explore the concept of the coordinate plane. In this coordinate plane lesson, students graph points on the coordinate plane using an applet. Students graph functions using an applet. Students play a Maze Game where they must...
Curated OER
Where am I Located
Learners calculate and find a certain location. In this geometry lesson, students examine a coordinate plane for pair of coordinates. They calculate the distance between point using the distance formula and estimation.
Curated OER
Tracking Your Favorite Web Sites
Ninth graders track the hit count on their favorite web sites. In this Algebra I lesson, 9th graders record the number of hits on their favorite web site for twenty days. Students explore the data to determine if the relation...
Curated OER
Trig is SOH Easy!
Learners derive the six trigonometric identities. In this trigonometry lesson, students review the parts of a right triangle and use the Pythagorean theorem as a guide to find the trig identities. They find sine, cosine and tangent ratios.
Curated OER
Human Coordinate Plane, Using the Distance Formula
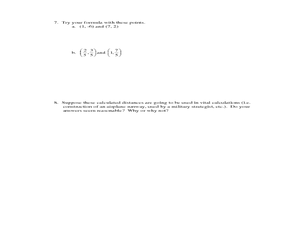
Students write the distance formula to solve equations for finding the distance between 2 points. In this distance formula lesson plan, students also write sentences explaining why their formulas would work.
Curated OER
Turtle Tales
Students watch videos and fill out worksheets about the turtles and their journey to the Costa Rican beach. In this turtles lesson plan, students learn and discuss survival, predator and prey, and stages of development.
Curated OER
Decoding Machine
Students are introduced to the concept of variables and their uses. In groups, they are given a code in which they must find the value of the missing words. To end the lesson, they find the value of words over ten letters long and their...
Curated OER
What is an Antiderivative? Slope Fields
Students take the derivative of a function. In this calculus lesson, students define slope fields and what they are used for. They relate slope fields to the real world.
Curated OER
Making Connections
Seventh graders relate patterns with higher math. In this 7th grade math lesson, 7th graders analyze different methods of portraying data. They relate the data to real life scenarios.
Curated OER
Modeling Population Growth
Learners collect data on population growth. In this statistics lesson, students graph their data and make predictions. They find the linear regression and the best fit line.
Curated OER
Online video games plus curriculum-based math equals an engaging educational tool.
Seventh graders use online math games to practice understanding the skill of estimation and order of operations. In this lesson, 7th graders use the internet to play online games to strengthen their understanding of these skills.
Curated OER
How Much Is Too Much?
Young scholars examine population growth and collect data. In this statistics instructional activity, students create a scatter plot to represent the different species found in the water and are being harvested. They graph their data and...
Curated OER
Cruising the Internet
Students identify the parts of an engine using a graph. In this statistics lesson, students make a graph from their collected data. They calculate the volume of a cylinder using a line of regression and a scatter plot.
Curated OER
Hot Wheels
Students observe the action produced by toy cars. In this geometry lesson, students discuss motion and distance as they relate to the movement of a spherical object.They collect data and make conjectures based on their data.
Curated OER
Line of Best Fit
Students identify the line of best fit. In this statistics lesson, students collect and analyze data. They calculate the regression equations and identify the different types of correlation.
Curated OER
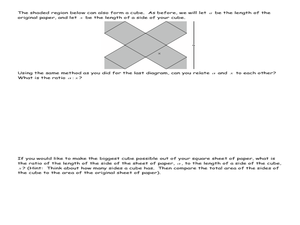
Origami Cube
Learners compare two lengths using the area of a square. In this geometry lesson, students solve problems using ratio and proportion of the two shapes. They solve equations by taking the square root of both sides.
Curated OER
Symmetry in Kaleidoscope Designs
Students define reflection, rotation and symmetry. In this symmetry instructional activity, students move the graph around the coordinate plane and identify the line of symmetry. They identify the different designs of a kaleidoscope.
Curated OER
Does Music Cam the Savage Beast?
Students collect, graph and analyze data. In this statistics lesson, students measure the heart beat of a person as they listen to music. They use the CBL and TI to create a graph, analyzing the outcome.
Curated OER
Regressive Music
Student use the Ti calculator to graph sinusoidal graphs. In this calculus lesson plan, students use the CBL to collect and analyze data of sinusoidal graphs. They manipulate their collected data and make predictions.
Curated OER
Conductivity of salt Solutions
Learners investigate the concentration level of solutions. In this math/science instructional activity, students identify three different ionic compounds. They predict the conductivity of each using their collected data.
Curated OER
Walking on Air
Young scholars collect and analyze data with a graph. In this statistics lesson plan, students use central tendencies to find the meaning of their data. They display the data on a Ti calculator.
Curated OER
Fun With Fractals
Students use fractals to analyze nature. In this geometry instructional activity, students work in groups using technology and math to communicate. They identify where in the real world fractal can be seen.
Curated OER
An Application of Congruence
Students solve triangles using the properties if congruency. In this geometry activity, students apply congruent and similar figures to solve real world and math problems. They show they are able to follow instructions.
Curated OER
Application of the Pythagorean Theorem
Students find the length of the hypotenuse using the Pythagorean Theorem. In this geometry lesson, students solve for the different parts of a right triangle. They work the first problem with-the teacher then work on their own.
