Curated OER
Systems of linear inequalities in standard form
Learners practice graphing linear inequalities and explain their solution sets to the solving of a system of linear equalities graphically and symbolically. They utilize programming techniques in setting up and solving systems of linear...
Curated OER
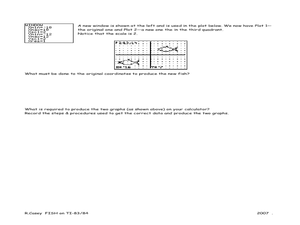
Fishing for Points TI-83/83 Plus
Ninth graders investigate the Cartesian coordinate plane. In this Algebra I instructional activity, 9th graders explore the coordinates of a drawing of a fish and examine the effects of moving the drawing on the ordered pairs....
Curated OER
Exponents and Logarithms Test
In this Algebra II/Pre-calculus worksheet, students solve advanced logarithmic and exponential equations. The two page worksheet contains ten multipart problems. Answers are not provided.
Curated OER
Rational Expressions
In this algebra worksheet, students identify the solution to rational expressions. They solve word problems using the correct formula and equation set up. There are 10 questions with a bonus.
Curated OER
Function Tables
Students identify function using tables of data. In this algebra lesson, students create a tale of point and plot on a coordinate plane. They analyze the graph as being a function or not.
Curated OER
Understanding Equations of Functions
Students write equations for different functions. In this algebra lesson plan, students observe data and find the function that goes along with that data. The identify the line of best fit.
Curated OER
Inverse Linear Functions
Students solve for the inverse functions. For this algebra lesson, students graph the inverse function and analyze it. They solve and manipulate equations using the calculator.
Curated OER
Geography: Lengths, Perimeter, and Area of Similar Objects
Sixth graders explore characteristics of similar objects. Using attribute blocks, they explore the ratios of the perimeter, area and side length in similar shapes. They calculate and compare the area of shapes.
Curated OER
What are the Odds
Students predict the-outcome of an event. In this algebra lesson, students compare and contrast the probability of an event occurring. They calculate the odds of a simple event and make estimation.
Curated OER
Strong Arm Iteration
Students solve exponential functions and inequalities. In this algebra lesson, students find the roots of equations and use it to graph and evaluate exponential functions. They simplify exponents using the law of exponents.
Curated OER
Exploring Infinite Sequences, Part II
In this algebra worksheet, students identify the nth term of the sequence. They find the missing term in the pattern and what theorem justifies their choice. There are 12 questions.
Curated OER
Slope of a Line
Students identify the slope of a line. In this algebra lesson, students discover the process of how to find the slope of a line and classify the slope as positive, negative, zero or undefined. They find the slope of a line given two...
Curated OER
Practice Chapter Test
In this algebra activity, students identify the property being used in each problem. They plot numbers on a number line. There are 30 questions.
Curated OER
Rational Functions
Students evaluate rational functions. In this precalculus instructional activity, students make observations and define what makes a rational function and what makes a linear function. They use the Ti calculator to visualize the...
Curated OER
Perimeter Pattern
High schoolers investigate perimeter patterns formed by a hexagon and a triangle. They will identify the dependent and independent variable and write a function for the relationship.
Curated OER
Complex Roots: A Graphical Solution
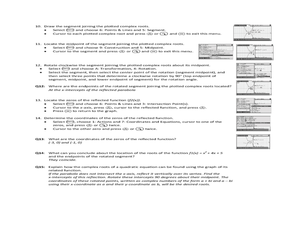
Using their Ti-Nspire to determine the solutions of parabolas, students explore the concept of complex roots. Students determine if parabolas have real or complex roots. Students determine the the axis of symmetry and the...
Curated OER
Properties of Parabolas
Learn to identify the properties of parabolas. Learners define parabola as the locus of all points equidistant from a fixed point and a fixed line. Also, interpret the equation for a parabola in vertex form and gain a visual...
Curated OER
Carbon Dating
Simulate C-14 decay using M&M and Reese's Pieces candies. In this scatter-plot lesson plan, students perform an experiment to simulate the half life of C-14. Information is plotted on a scatter-plot. Students answer four...
Curated OER
Curve Ball
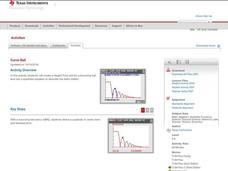
Learners explore the concept of parabolas by collecting quadratic data on a bouncing ball as it is falling using a motion detector. They plot the data and determine the equation of the quadratic in vertex form, then determine the values...
Curated OER
Taking the Temperature
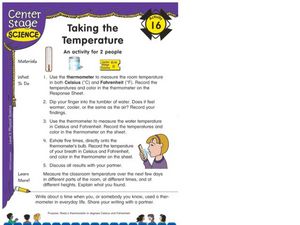
Students read a thermometer in Celsius and Fahrenheit. In this thermometer reading lesson, students take the temperature in different situations and discuss the results with a partner.
EngageNY
Modeling Riverbeds with Polynomials (part 2)
Examine the power of technology while modeling with polynomial functions. Using the website wolfram alpha, learners develop a polynomial function to model the shape of a riverbed. Ultimately, they determine the flow rate through the river.
EngageNY
Modeling Riverbeds with Polynomials (part 1)
Many things in life take the shape of a polynomial curve. Learners design a polynomial function to model a riverbed. Using different strategies, they find the flow rate through the river.
EngageNY
Sampling Variability in the Sample Proportion (part 2)
Increase your sample and increase your accuracy! Scholars complete an activity that compares sample size to variability in results. Learners realize that the greater the sample size, the smaller the range in the distribution of sample...
EngageNY
Analyzing Residuals (Part 2)
Learn about patterns in residual plots with an informative math lesson. Two examples make connections between the appearance of a residual plot and whether a linear model is the best model apparent. The problem set and exit ticket...

