Curated OER
Power Function Inverses
Pupils graph polynomial functions and analyze the graphs. They identify the inverse of the functions and find the domain and range. Learners will then label the functions as one to one and use the horizontal and vertical line test to...
Curated OER
What Are My Chances?
Students calculate probability. In this lesson on probability, students use given data to calculate to chances of a given event occurring. Many of the calculations in this lesson are applicable to daily life.
Curated OER
Velocity
In this pre-calculus worksheet, students calculate the velocity of a linear graph by observing the slope of a line. There are 10 velocity questions.
Curated OER
Analyzing Equations Through Slope and Y intercepts
Young scholars analyze equations using the slopes and intercept. In this algebra lesson, students graph equations give the slope and y intercepts. They are also asked to identify the slope and y intercept from a given graph. They solve...
Curated OER
Analyzing Equations Through Slope and Y intercept
Students analyze equations using the slope and y-intercept. In this algebra lesson plan, students identify the slope using a and the intercept using m. They graph linear equations based on the slope and intercept.
Curated OER
Dinosaur Tracks: From Stride To Leg Length To Speed
Students determine the relationship between leg length, stride length, and speed in humans and bipedal dinosaurs. They collect data and graph these human characteristics then use actual data collected from dinosaur track pads and fossils...
Curated OER
Volume and Surface Area: Which Is More?
Learners explore the volume and surface area of three dimensional figures. Through the use of video, students discover three dimensional shapes, their uses in real-life applications, and methods used to calculate their volume and surface...
Curated OER
Determining Area
High schoolers conduct chemical experiments. In this chemistry lesson, they investigate reactions using the CBL system. Learners will graph and analyze their data using a TI.
Curated OER
Properties of Exponential Functions
In this algebra activity, students graph exponential equations and use the formula to translate the graph on a coordinate plane. There are 3 word problems.
Curated OER
Celsius to Fahrenheit
Students convert degrees between two different units. In this algebra lesson, students graph linear equations and identify the line of best fit. They use their line of best fit to make predictions given a set of data.
Curated OER
Natural Logarithm
Young mathematicians solve problems of logs and natural logs. They graph functions of natural logs on the TI and relate integrals to natural logarithms.
Curated OER
Solving Systems using Elimination
Using elimination to find the point of intersection of two lines, students learn to solve systems of equation. They graph their solutions and use the TI to verify the solution.
Curated OER
Watch Your P' and Q's
Pupils solve polynomial functions by graphing. They factor rational expressions to find the roots of the equation and apply the rational zero theorem to find the zeros of a polynomial.
Mathematics TEKS Toolkit
Grade 6: Exploring c/d = pi
Introduce your math class to the perimeter of a circle. Teach them that pi describes the relationship between the circumference and the diameter. As a hands-on investigation, pairs or small groups use string to compare these two values...
Curated OER
Which Way?
Middle schoolers explore distance-time plots. In this algebra lesson, they will investigate how different types of motion affect the distance-time plot.
Curated OER
Lines of Fit
Learners analyze graphs. For this algebra lesson, students find the line of best fit, using scatter plots. They calculate the sale of popcorn as it relates to the price. They then analyze the graphs for positive, negative and no...
Curated OER
Lines of Fit
Students solve equations dealing with best fit lines. In this algebra lesson, students solve problems by analyzing data from a scatterplot, and define it as positive, negative or no correlation. They classify slopes the same way as...
Curated OER
Graphic Designing with Transformed Functions
Teach your class how to transform a graph! By identifying the domain and range of the functions, students can observe the parabola and find the vertex of the transformed graph.
Curated OER
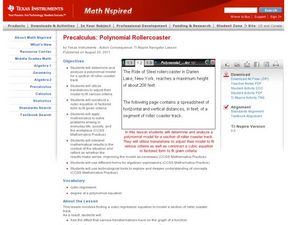
Polynomial Rollercoaster
Learners relate polynomials to a rollercoaster track as they translate a graph around on a coordinate plane. They differentiate between different forms of algebraic expressions.
Curated OER
Wildlife Management
Students examine the effects of various management strategies on the size of wildlife populations. Each student simulates the management of an animal population in a card game, graphs the results of the wildlife game, and participate in...
Curated OER
A Geological Puzzle
Students compare and contrast the various types of rocks on each continent. In groups, the calculate the rock ages and types to determine if the continents, in their opinion, were joined at one time. They develop two imaginary...
Curated OER
Finding and Estimating Square Roots
In this algebra worksheet, students solve the square root through estimation and through the calculator. They graph their solutions on a number line. There are 4 questions with an answer key.
Curated OER
Finite Differences
Young mathematicians solve problems with polynomials. As they graph and analyze polynomial functions, learners define constant and finite, and determine the relationship between the constant set of differences and the slope of a linear...
Curated OER
Lines of Fit
Students graph an equation and analyze the data. In this algebra lesson, students graph scatter plots and identify the line of best fit using positive correlation, negative correlation an d no correlation. They apply their data analysis...


