Curated OER
Rewriting Equations &Formulas
Practice with literal equations. Solve for one variable in terms of another. Find the value of y given specific values of x. This short worksheet would make a good warm-up activity at the beginning of class or a quick assessment at...
Curated OER
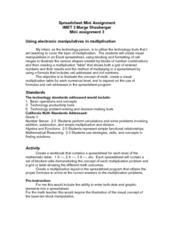
Using Electronic Manipulatives in Multiplication
Factor polynomials using electronic manipulatives. Your class will create a spreadsheet in excel and use it to multiply and perform basic operations and solve problems correctly. They create a visual to go along with each multiplication...
Illustrative Mathematics
Complex number patterns
Start off with the definition of the imaginary number i, then have your class practice simplifying expressions involving powers of i and look for patterns. See how the cyclic nature of powers of i translate to sums of powers of i.
Curated OER
Introduction to Limits
High schoolers practice using graphing calculators and spreadsheets as they explore numeric limits using sequences and functions. They complete a sequencing worksheet, and determine which sequence corresponds to story a story called...
Curated OER
Maps and Modes, Finding a Mean Home on the Range
Fifth graders investigate data from maps to solve problems. In this data lesson, 5th graders study maps and collect data from each map. Students present their data in a variety of ways and calculate the mode, mean, median, and range.
Curated OER
Translate Word Phrases and Sentences into Equations
Use this video to show your learners an example of how to translate word phrases into an equation to solve a real-world problem. The presenter begins with a review of how to use cross products to solve a proportion, including how to do...
Curated OER
Worksheet 7 - Asymptote
In this asymptote worksheet, students compute limits, graph vertical asymptotes, and find the slope of the secant line. This one-page worksheet contains six multi-step worksheets.
Curated OER
Worksheet 8 - Limit of Slopes
In this limit of slopes worksheet, pupils compute the limit of slopes, find the slope of the secant line, and determine the slope of the tangent line. This one-page worksheet contains five multi-step problems.
Curated OER
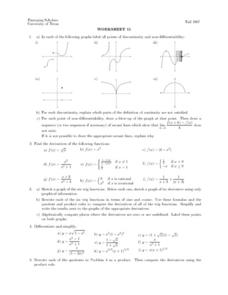
Worksheet 11 - Points of Discontinuity
In this points of discontinuity worksheet, students observe graphs and label them as points of discontinuity and non-differentiability. They identify the derivatives of functions. This one-page worksheet contains five multi-step problems.
Shodor Education Foundation
Surface Area of Rectangular Prism
With this interactive lesson, learners compute the surface area of rectangular prisms. They visit an online investigation applet and record data on the provided handout. Pair this lesson with the volume lesson by the same publisher as an...
Shodor Education Foundation
Volume of Prisms
Explore the concept of volume of prisms using an applet to perform the calculations. The link to the interactive applet is embedded into the lesson plan as well as a link to associated data sheets. Get your math class to the computer lab...
Curated OER
Volume of Rectangular Prisms
Introduce the procedure needed to find the volume of a rectangular prism. Learners rank various prisms such as cereal boxes and tissue boxes from smallest to largest volume. They use an applet to find the volume and surface area of each...
Curated OER
The Method of U-Substitution
In this calculus learning exercise, students solve problems using U-Substitution. They find antiderivatives using indefinite integrals. There are 18 questions with an answer key.
Noyce Foundation
Snail Pace
Slow and steady wins the race? In the assessment task, scholars calculate the rates at which different snails travel in order to find the fastest snail. Hopefully, your class will move much more quickly in finishing the task!
NASA
Next Generation Spacecraft - Orion
Emergine space engineers discover the area of complex geometric shapes. They find that, just as a spacecraft is composed of many smaller parts, so can polygons be broken into smaller shapes.
Curated OER
Active Loads in Amplifier Circuits
In this electrical worksheet, students answer a series of 7 open-ended questions with schematics about active loads in amplifier circuits. This worksheet is printable and the answers are available on-line.
Curated OER
Equations in Motion: Design and construct a mobile
Students participate in a lesson plan that covers the concepts of solving equations and inequalities. To master the concept they must demonstrate visually and verbally how both sides of an equation must be balanced. They construct a...
Curated OER
I want a credit card--or do I?
Students pretend to borrow $1000.00 on a credit card. They pretend to make the minimum payments for a year. When they're done, they make a pie chart showing how much of their payments reduced their debt, and how much was interest.
Curated OER
Carbon Dating
Simulate C-14 decay using M&M and Reese's Pieces candies. For this scatter-plot lesson, students perform an experiment to simulate the half life of C-14. Information is plotted on a scatter-plot. Students answer four comprehension...
Curated OER
Using Excel To Teach Probability And Graphing
Students engage in the use of technology to investigate the mathematical concepts of probability and graphing. They use the skills of predicting an outcome to come up with reasonable possibilities. Students also practice using a...
Curated OER
Area Unit
Students solve the area for parallelograms,squares, rectangles, trapezoids, and triangles. In this geometry lesson, students compare and contrast two dimensional shapes and apply their properties to solving real life scenarios. This is a...
Curated OER
Volume and Surface Area: Which Is More?
Students explore the volume and surface area of three dimensional figures. Through the use of video, students discover three dimensional shapes, their uses in real-life applications, and methods used to calculate their volume and surface...
Curated OER
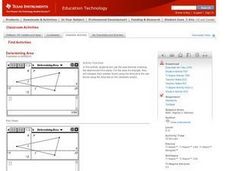
Determining Area
High schoolers conduct chemical experiments. In this chemistry lesson, they investigate reactions using the CBL system. Learners will graph and analyze their data using a TI.
Center of Excellence for Science and Mathematics Education
A Sick Astronaut
Aspiring astronauts graph, interpret, and analyze data. They investigate the relationship between two variables in a problem situation. Using both graphic and symbolic representations they will grasp the concept of line of best fit to...

