Pennsylvania Department of Education
Adding and Subtracting Rational Numbers to Solve Problems
Students explore the concept of probability. In this probability activity, students use area to determine probability. Students use charts and spinners to help determine the probability of events such as flipping a coin or rolling a...
Curated OER
Let's Flip a Coin
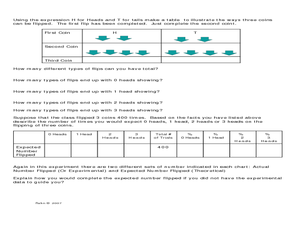
In this probability worksheet, students use a TI graphing calculator to simulate flipping a coin and compare their results (experimental probability) to the expected results (theoretical probability). The five page worksheet contains...
Curated OER
High Five Board Game
In this high five board game worksheet, 8th graders use the game board and instructions provided to create ordered pairs using dice and cubes, then analyze the probability and predict outcomes.
Curated OER
What's Math Got To Do With It?
Students explore numbers, computation, ratios, proportions, probabilities, statistics, and money in this six lessons unit. Practical applications in the real world are emphasized through an interactive approach to math in these lessons.
Curated OER
First Willett Math Club Contest
For this word problems worksheet, students complete word problems involving combining outfits, probability, magic, and more. Students complete 5 problems.
Curated OER
Investigation-What are My Chances?
Second graders explore probability. In this math lesson plan, 2nd graders discuss the possibility of choosing a certain colored tile from a bag. Students perform experiments and describe the outcomes as certain, possible, unlikely and...
Curated OER
Data Displays with Excel
Students collect and analyze data. In this statistics lesson, students display their data using excel. They plot the data on a coordinate plane and draw conclusion from their data.
Shodor Education Foundation
Tree Diagrams and Probability
Aspiring statisticians create tree diagrams and figure probabilities of events based on those diagrams. They practice adding and multiplying fractions and explain complementary probabilities. Students use computers activities to make...
CK-12 Foundation
Venn Diagrams: T-Shirt Mystery
Sorting your t-shirts is easy with Venn diagrams. Individuals use a drag and drop interactive to classify shapes on t-shirts into Venn diagrams. A set of challenge questions tests whether the classification is correct.
Curated OER
Arithmetic: Fractions
In this fractions instructional activity, learners add positive and negative fractions with unlike denominators. They compute a fractional part of a number. This six-page instructional activity contains approximately 20 problems....
Curated OER
Probably Pistachio
First graders practice making logical predictions from information they are given.
Curated OER
Familiar Commands
Familiar commands are probably used more frequently than formal commands, so make sure you spend an adequate time covering them. This learning exercise provides great explanation, a clear chart, and a practice opportunity. It's a great...
Curated OER
Represent Outcomes
In this possible outcomes worksheet, students analyze a tree diagram of music and theater events. Students solve 6 story problems.
Curated OER
Assessing and Investigating Population Data
Students examine population projections. In this population data lesson, students research and collect data on the population of the United States. They explore and conclude future population growth patterns. Students construct tables...
Curated OER
Game of Fifty
In this statistics worksheet, learners play a game of fifty. The object of the game is to reach fifty before anyone else. This is fun game to review addition and odd and even numbers.
EngageNY
Using Expected Values to Compare Strategies
Discover how mathematics can be useful in comparing strategies. Scholars develop probability distributions for situations and calculate expected value. They use their results to identify the best strategy for the situation.
Virginia Department of Education
Mathematics Vocabulary Cards - Grade 2
Augment your math curriculum with posters detailing several concepts important to second grade math. Each poster features one math term from geometry, measurement, probability and statistics, computation and estimation, numbers and...
5280 Math
Integer Interpreter
Can you add variables if you don't know their value? Using an empty number line, scholars first locate the position of the difference, sum, product, and quotient of two unknown integers. Later problems mix operations as well as add...
Curated OER
Throat Culture
In this biology worksheet, students review the procedures used to complete the lab activity and then examine the purpose and add the information while answering the questions.
Curated OER
Predictions Survey
Help English learners make predictions using appropriate language through a survey. Each learner will ask a series of questions to 5 different students and then create a short report on their findings. Modifications: Add your own series...
Perkins School for the Blind
Conservation of Mass
How do you teach a student with visual impairments about the conservation of mass? You use tactile models that represent the theoretical concept. Baking soda and vinegar are used to add gas to a deflated balloon. Learners will feel the...
Denton Independent School District
Elements of Art: Name Design Project
Introduce your class to the seven elements of art through a presentation and related project. Before beginning the project, class members take notes on the presentation, writing down the underlined items and adding drawings into their...
CK-12 Foundation
Regular and Irregular Polygons: Polygon States
Colorado would probably object if Wyoming enlarged its borders. Scholars use an interactive map to change the borders of U.S. states to see how angles change. They then answer questions about regular and irregular polygons.
CK-12 Foundation
Properties of a Normal Distribution: Uniform Distributions
There's nothing normal about an extraordinary resource. Scholars change the dimensions of a normal distribution using a slider interactive. Determining the area under the graph gives probabilities for different situations.


