Curated OER
Insect Classification
Young scholars compare and contrast the visible structures of three insects based on photographs. They differentiate characteristics of crane flies, ants, and wasps then create a simple classification system.
Curated OER
High Exposure
Students interpret data they receive from the media, discuss possible misinterpretation of data from the media and correctly respond to the misconception quiz question.
Curated OER
The Role of Lawyers
Twelfth graders compare and contrast the role of lawyers in Japan and the United States. After viewing movies and television shows, they make guesses about the justice system in the United States. They answer discussion questions and...
Curated OER
Parachutes: Is it Surface Area or Shape?
Students investigate how to make a good parachute. In this physics lesson, students observe the motion of parachutes as it falls and measure the time. They collect data and calculate the average descent time for each canopy shape.
Curated OER
Rotation Sensor Challenge
Pupils participate in a challenge to construct a rotation sensor with the highest degree of accuracy and repeatability. They conduct computer analysis of their sensor using repeated trial.
Curated OER
Inventors Unit Survey
Students develop and conduct a survey for their inventors unit. They create a five question survey and tally the survey results, and create a graph using Microsoft Word and Graph Club 2.0.
Curated OER
Missing Macroinvertebrates
Learners investigate the concept of a macroinvertebrate. They observe the presence of increases or decreases in population in order to test for factors that contribute to the extinction of a species. Students predict the likelihood of...
Curated OER
Theoretically Speaking
Students define probability. They determine outcome from a given situation based on simple probability. Students create experimental data using a coin and a number cube. They write how theoretical and experimental probability are different.
Curated OER
Let's Go Camping
Fifth graders plan a budget for a camping trip. They use a spreadsheet to organize the budget and word processing justification for their choices.
Curated OER
Drawing Conclusions
Students play a probability game, then design and complete a probability problem concerning changing odds.
Curated OER
Earth Day Trash Survey Unit
Students analyze the data from questionnaires to prepare a report. They distribute the report via e-mail or through a report published on a Web page to those who participated.
Curated OER
Graphing With RXTE
Young scholars use data from the Rossi X-ray Tiiming Explorer (RXTE) satellite to analyze and graph.
Curated OER
Don't Throw Away That Junk Mail!
Fourth graders study junk mail to learn the techniques that advertisers use to attract and hold a person's attention.
Curated OER
Themes and Patterns of History
Fourth graders, in groups, explore recurring historical and geographical themes.
Curated OER
Photoelectric Devices
Fourth graders view a teacher-made PowerPoint presentation on how photoelectric devices work, and then they answer FCAT-like questions on the material presented. They answer questions about what they viewed in an assignment imbedded in...
Curated OER
What You See Is What You Get
Students practice visualization as a strategy for reading and comprehending math word problems.
Curated OER
National Trends Create Regional Change: Agriculture Gives Way to Industry
Students relate the economic growth of 18th century Deerfield, CT to that of America today.
Curated OER
Lesson 3: Lobster Roll!
Students play a game that illustrates the delicate ecological balance between fishing, fishing regulations and fish populations. They collect data and analyze the results.
Curated OER
Did You Feel That? Earthquake Data Chart
Students plot earthquakes on the world map using coordinates of longitude and latitude. They designate the earthquakes magnitude with a symbol which they include in the map key.
CK-12 Foundation
Ck 12: Statistics: Inferences About Regression
[Free Registration/Login may be required to access all resource tools.] This Concept introduces students to testing a claim about linear regression.
Texas Instruments
Texas Instruments: Statistics With List Editor App
The list editor provides a means for viewing, editing, and working with data lists. Students can explore distributions, tests, intervals, multiple regression, random sampling, goodness of fit and inferential statistics.
Texas Instruments
Texas Instruments: Statistics Pretest
This is a pre-test for a statistics class. Since most systems want data driven analysis, this is a great way to get data at the beginning of the course on how much students know about statistics.
Khan Academy
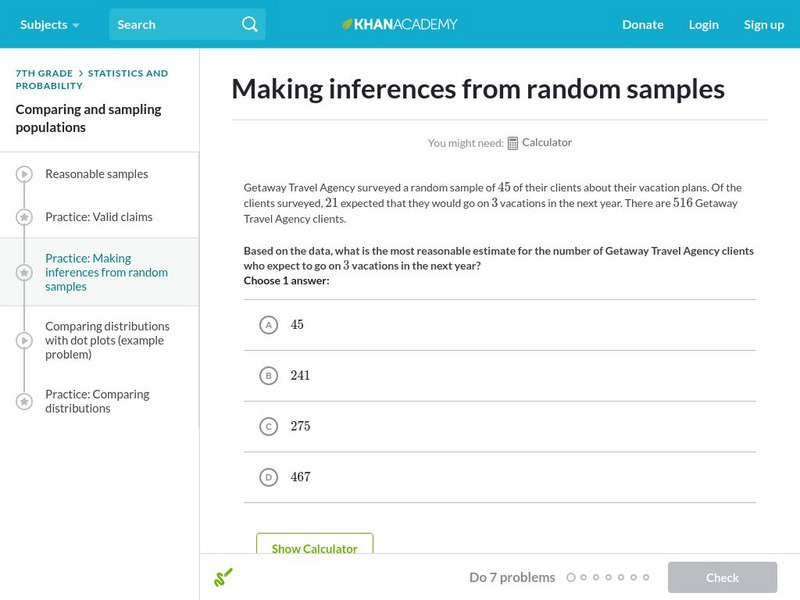
Khan Academy: Making Inferences From Random Samples
Practice making inferences from random samples.
CK-12 Foundation
Ck 12: Statistics: Sampling Distributions
[Free Registration/Login may be required to access all resource tools.] This concept introduces the sampling distribution of the mean, inferring the population mean from samples and sampling error.


