Curated OER
Spreadsheets and Database in Social Studies
Fifth graders create/use spreadsheets to solve real-world problems, explore patterns and make predictions, select/explain most appropriate types of graph to display data, and enter data into a prepared spreadsheet to perform calculations.
Curated OER
Basic Excel
Learners explore basic Excel spreadsheets. In this spreadsheet lesson plan, students enter Alaska weather information and perform calculations. Learners title the columns on the spreadsheet and format the cells. ...
Curated OER
Escape Velocity
Sixth graders create/use spreadsheets to solve real-world problems, explore patterns, make predictions, select/explain most appropriate types of graph to display data, use information to create product, and have basic understanding of...
Curated OER
Graphically Speaking
Students discover the links between population and Congressional representation. For this government lesson, students research population statistics and create spreadsheets that compare population to the number of Congress members per...
Curated OER
Spreadsheets in Science
Fourth graders create spreadsheets, explore patterns and make predictions based on the information. They select the appropriate graph to display the spreadsheet data. They search and sort prepared data bases to gain knowledge for...
Curated OER
American Colonies
Students record information in a database about the three American colonies. They are comparing and contrasting them. They are to log into a given database and fill in the corresponding sections. Once it is filled in the similiarities...
Curated OER
And the Survey Says...
Students use technology to input, retrieve, organize, manipulate, evaluate, and communicate information; apply appropriate technologies to critical thinking, creative expression, and decision-making skills. They collect and explore data...
Curated OER
Cloud Databases
Students complete a unit on clouds and a report about one type of cloud. They collect data through observation about different types of cloud cover and then create a spreadsheet to reflect their observations over a 2 week period.
Curated OER
It's 'ELEMENT' ary
Students, using a Web site about the periodic table of elements, create spreadsheets representing elements and their properties. They also create graphs that compare the physical properties of the elements.
Curated OER
Electronic Spreadsheets & Iditarod 2000
Students use the Internet for gathering information for Iditarod race journals. They use a spreadsheet program for entering data and making charts for showing changes in speeds achieved over a period of four weeks in timed writings in...
Curated OER
First Class First? Using Data to Explore the Tragedy of the Titanic
Students analyze and interpret data related to the crew and passengers of the Titanic. They research information on a Titanic database to illustrate specific statistical conclusions, and whether or not social status affected the outcome.
Curated OER
Family Search We All Came To America
Eighth graders participate in a computer based Family Search Unit. They use multimedia resources to research their country of origin, conduct interviews, and use software to produce narratives, databases, spreadsheets and graphs in this...
Curated OER
Are You Here Today?
Students recognize their own name in print and the names of their classmates. They use one to one correspondence to determine who has not checked in, completed their field, and if absent indicate that on the form. Students tally the...
Curated OER
Embracing Diversity
Ninth graders discover that the amount surveyed affects the results and conclusions drawn from a survey. In this sampling lesson students explore the concept that a valid conclusion require a large number of entries. Students...
Curated OER
Environmental Risk Analysis
Students complete a survey and enter the responses in a spreadsheet. The spread sheet is used to create a bar graph. Students complete spreadsheets listing types of hazards in their community.
Curated OER
Finding Mean, Mode and Median in the Computer Lab
Students create spreadsheets which will display and figure mean, median, and mode of a set of numbers.
Curated OER
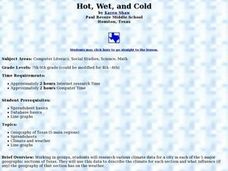
Hot, Wet, and Cold
Students research climate data for a city in each of the 5 major geographic sections of Texas. They use data to describe the climate and what influence the geography of that section has on the weather.
Curated OER
Comparing Weather Conditions
Pupils conduct research on temperature, wind speed and weather conditions from a variety of areas. They organize their findings on worksheets and spreadsheets and discuss various examples of databases.
Curated OER
Space Presents Problems
Students use the internet to research problems related to space. They complete a questionaire to direct their research before beginning. They create a database of moon and planet characteristics.
Curated OER
Western Hemisphere
Fourth graders use a database to compare countries in the western hemisphere. They describe a variety of regions in Texas and the Western Hemisphere such as political, population, and economic regions that result from patterns of human...
Curated OER
The Birds of a Feather Flock Together
Fifth graders identify all parts of an egg, and explore their importance to the life cycle of a chicken. Learners compare all sorts of birds and place them in categories based on what they look like. This five-day activity effectively...
Curated OER
Pumped Up Gas Prices
Students calculate gas prices. In this transportation lesson, students tally the mileage and gas costs of their car for one months. They figure out how much was spent on gas and create a graph showing average gas prices over time.
Curated OER
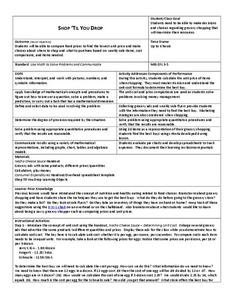
Shop 'Til You Drop
Students evaluate food prices. For this real world math lesson plan, students compare the cost of various grocery items to determine which is the best deal. They work in groups using grocery ads to decide how to get the most product for...
Curated OER
Career Exploration
Students complete a unit about career choices. They conduct research on a selected career that interests them, conduct an interview, explore various websites, create a five-page HyperStudio stack, and write ten checks that relate to...
