Curated OER
Statistics: Reading and interpreting production graphs
Students interpret and create different types of graphs. They analyze data from charts, develop a survey and design appropriate graphic illustrations and make a presentation.
Curated OER
Leveled Problem Solving: Slope
In this problem solving learning exercise, 7th graders focus on slope. Students solve 6 problems using the given coordinates for each.
Curated OER
Rational Functions and Their Graphs
In this Algebra II worksheet, 11th graders examine the graphs of rational functions, identifying the points of discontinuity and the vertical and horizontal asymptotes. The three page worksheet contains explanation of topic, several...
Curated OER
Building Venn Diagrams
Students use Venn diagrams to solve prime number and factorization problems. In this multiplication lesson, students watch a video and use a Venn Diagram to help them solve a pizza math activity that uses prime factorization. Students...
Curated OER
Graphing Linear Equations
Learners graph linear equations. In this algebra lesson, students solve linear equations and graph it on a coordinate plane. They evaluate integers using linear equations.
Curated OER
Is That a Plan? Problem-Solving: Using Diagrams and Models
Student solve problems using a flow chart. They solve real-world problems by using a diagram or model. They create their own diagrams for problem-solving. They explain how they drew the diagram and solved the problem.
Curated OER
Solving Systems Algebraically
In this algebra lesson, students solve systems of equations. They solve using substitution and elimination. There are 10 questions.
Curated OER
Graphing Linear Equations and Slopes
Pupils explore linear equations, parallel lines, perpendicular lines and slopes. Using computers with graphic calculators and word processing, students examine the relationship between the slopes of perpendicular lines and parallel...
Curated OER
Graphs of Logarithmic and Exponential Functions
Students watch as the teacher demonstrates that y=ln(x) and y=e^x are inverse functions. They graph these equations on the same axes. Students work other log functions. They learn a Reggae Song about the log of the quotient. Students...
Curated OER
Graphing Systems of Equations
In this systems of equations worksheet, students use graphs to solve systems of equations. They determine if the equation contains one solution, no solution, or many solutions. This one-page worksheet contains ten problems.
Curated OER
ACT Questions of the Day 5/21/08
In this ACT practice learning exercise, students solve the ACT question of the day in which they select the graph that represents the inequality equation. There are 5 graphs to choose from.
Curated OER
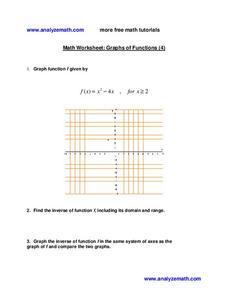
Graphs of Functions
For this graphs of functions worksheet, 9th graders solve and complete 3 different types of problems. First, they graph function f given by the functions shown on the grid. Then, students find the inverse of a function including its...
Curated OER
Graphing Hyperbolas
In this graphing hyperbolas learning exercise, 11th graders solve and complete 10 various types of problems. First, they sketch each graph given the equation. Then, students determine which of the graphs shown is the equation.
Curated OER
Linear Equations and Their Graphs
In this Algebra I/Algebra II worksheet, students solve problems involving interpreting the slope of a linear equation as a rate of change. The two page worksheet contains a combination of seven multiple choice and free response...
Curated OER
Graphing Solution of a Quadratic and Linear System
In this algebra worksheet, students identify the systems of equation as quadratics or linear. They graph their solutions. There are 4 questions with an answer key.
Curated OER
Solving Systems by the Elimination Method
Pupils solve equations by elimination and use the TI to graph the lines and find the point of intersection.
Curated OER
Constructing and Solving Linear Equations
Young scholars construct and solve linear equations. In this algebra lesson, students solve equations and graph lines using the slope. They identify the different parts of an equation including the leading coefficient.
Curated OER
Constructing and Solving Linear Equations
Students solve linear equations In this algebra lesson, students create linear equations using integer coefficients greater than one. They graph their solution on a coordinate plane.
Curated OER
Why Did the Plum Divorce the Grape? What Did the Boy Tree Say to the Girl Tree?
For this solving inequalities worksheet, students graph and shade 15 inequalities. Students then use their shading to help answer the two riddles.
Curated OER
Solving Inequalities
In this solving inequalities worksheet, 10th graders solve and complete 9 different problems that include defining various inequalities. First, they define compound inequality and describe the difference between an 'and' and an 'or'...
Curated OER
Graphing Trig Functions
In this graphing trigonometric functions learning exercise, 11th graders solve and complete 10 various types of problems. First, they graph each functions as shown. Then, students find the domain in each given function. In addition, they...
Curated OER
Graphing Functions
In this graphing functions worksheet, students solve and complete 16 various types of problems. First, they evaluate each of the limits provided. Then, students graph each of the functions and their asymptotes as given.
Fuel the Brain
Interpret Pictographs
Have your youngsters use a graphic organizer and key to solve the following questions. By learning to interpret the pictographs, they will solve the problems accurately.
Curated OER
Data Handling: Tally Chart on Illnesses
In this tally chart worksheet, students analyze a chart showing childhood illness cases. Students use the tally chart to solve 6 problems.


