Hi, what do you want to do?
Texas Instruments
Texas Instruments: Ball Bounce
This activity allows students to use real data obtained by them to model quadratic equations. students can use the TI-83 and/or TI-84 and a motion detector to collect their data. The students will then manually fit both quadratic and...
Texas Instruments
Texas Instruments: Canadian Life Expectancy
In this activity, students analyze statistical data Using the calculator and the TI-InterActive! software. They perform regression on the data to find the life expectancy of people in Canada.
Texas Instruments
Texas Instruments: Exploring the Golden Arches
Using given nutritional information of popular items from McDonald's, the students will develop and test a conjecture based on the given information. The students will analyze the two-variable data using the graphics calculator by...
CK-12 Foundation
Ck 12: Algebra: Applications of Function Models
[Free Registration/Login may be required to access all resource tools.] In this lesson students draw a scatter plot of data, find and draw the function that best fits that data, and make predictions from that information. Students watch...
Texas Instruments
Texas Instruments: Exploring Circles
Explore the relationship between the center and radius of a circle and the equation of the circle. Collect data and determine regression equations related to various combinations of data, and use the regression equations to make...
Texas Instruments
Texas Instruments: Work vs. Leisure
Students can use lists of data and the correlation factor of various regressions to determine the best regression line.
Illustrative Mathematics
Illustrative Mathematics: S Id Coffee and Crime
This task addresses many standards regarding the description and analysis of bivariate quantitative data, including regression and correlation. Given a scatter plot, students will answer a variety of questions about linear relationships,...
Concord Consortium
Concord Consortium: Trees in a Diagnosis Game
In this dynamic data science activity, students use data to build binary trees for decision-making and prediction. Prediction trees are the first steps towards linear regression, which plays an important role in machine learning for...
Texas Instruments
Texas Instruments: Do You Have a Temperature?
In this activity, students represent and analyze climate data. They use linear regressions to understand the relationship between temperatures measured in the Fahrenheit and Celsius scales and examine conversion factors.
Texas Instruments
Texas Instruments: Muddy Footprints Adventure 11
In this adventure, students will analyze the relationship between height and stride length, and then use that information to identify the biker who left the footprints. They create a scatter plot, find the linear regression equation for...
Texas Instruments
Texas Instruments: Greenhouse Gas Emissions
In this activity, students analyze statistical data using the calculator and the TI InterActive! software. They use linear regression to study the increase in levels of carbon dioxide emission over the years.
Other
Honolulu Community College: Galileo's Kinematics
In this experiment you will attempt to reproduce Galileo's results using the inclined plane. You will test three hypotheses relating to motion on an incline. You will learn to draw a "best fit" or regression line of experimental data....
TeachEngineering
Teach Engineering: Light Intensity Lab
Students complete this Beer's Law activity in class. Students examine the attenuation of various thicknesses of transparencies. From this activity, students will understand that different substances absorb light differently. This can...
TeachEngineering
Teach Engineering: Latex Tubing and Hybrid Vehicles
This unit gives students the opportunity to make use of linear models in order to make predictions based on real-world data. Students experience how engineers address incredible and important design challenges through the use of linear...
Rice University
Rice University: The Hand Squeeze
Students will enjoy this data collection and class analysis experiment involving the time it takes for a hand squeeze to travel around a circle of people. From organizing the activity to collecting the data to making a table and graphing...
Texas Instruments
Texas Instruments: Predicting White Blood Counts
Students find equations, which best-fit the data, using different regression models built into their calculators. The best method of handling this data, is to break the data into sections and fit different periods of time with different...
Texas Instruments
Texas Instruments: Growing Babies
In this activity, students observe and graph data about human fetal growth rates. Students build a regression model based on the data and compare values with those of other mammals. They also compare the data to non-mammal species.
Texas Instruments
Texas Instruments: Math Today Breast Cancer Risks
Cross curricular lines while integrating technology into your classroom to study a real-world application of logistic regression. This activity shows students how to enter data into their graphing calculators and perform a regression in...
Texas Instruments
Texas Instruments: Influence and Outliers
In this activity, students will identify outliers that are influential with respect to the least-squares regression line. Students will describe the role of the location of a point relative to the other data in determining whether that...
McGraw Hill
Glencoe Mathematics: Online Study Tools: Self Check Quiz on Linear Functions
The online assessment demonstrates knowledge of advanced mathematical concepts in Algebra II. The questions test students on linear functions. Topics include modeling real-world data with linear functions, scatterplots, and regression...
Texas Instruments
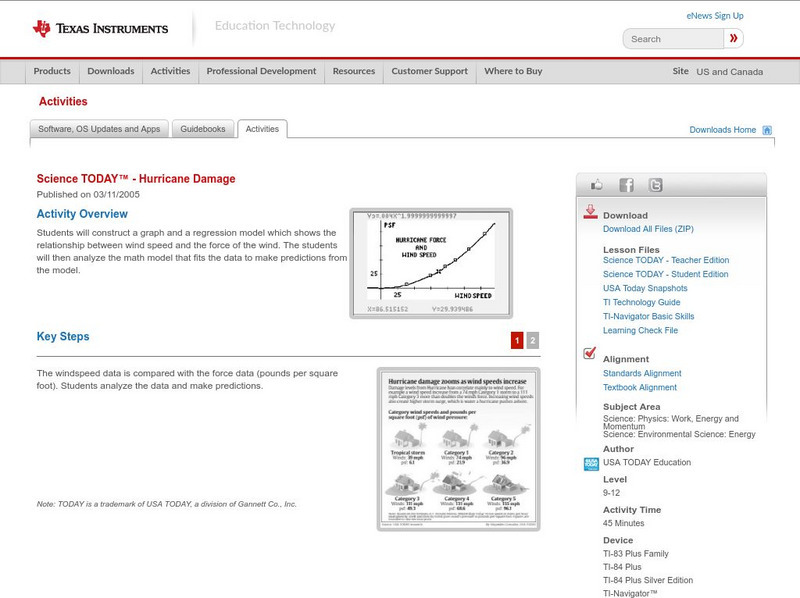
Texas Instruments: Science Today Hurricane Damage
Students will construct a graph and a regression model which shows the relationship between wind speed and the force of the wind. The students will analyze the math model that fits the data to make predictions from the model.
Texas Instruments
Texas Instruments: Glencoe Algebra 1: Graphing Calculator Investigation Curve
Students will make scatter plots and find the appropriate regression equations that best fit the data.
Texas Instruments
Texas Instruments: The River of Life
In this activity, students compare human body mass with blood volume. They graph the data and build a regression model. They estimate their own blood volume and also predict volumes of blood for other animals.
Texas Instruments
Texas Instruments: Forecasting
Students use regression to forecast values from a data. They study exponential smoothing. They also use the program FORECAST to automate a multiplicative model.


