Hi, what do you want to do?
Thinkport Education
Thinkport: Algebra Ii: Linear, Quadratic and Exponential Regression
Review linear regression and analyze how well this model fits the data. You will also be introduced to residuals and the correlation coefficient, and use these tools to determine whether or not a linear model is the best fit for a set of...
Texas Instruments
Texas Instruments: What Is a Linear Regression?
In this activity, students create lists of data points, plot them on a graph, and determine the regression equation of the best fitting line. They also understand exactly how the linear regression is determined.
Texas Instruments
Texas Instruments: Bivariate Data
This set contains statistics questions regarding bivariate data: scatter plots, the least-squares regression line, and their interpretation. The student is asked about the meaning of the various strengths and directions of linear...
Texas Instruments
Texas Instruments: Inference for Correlation and Regression
In this activity, students test if a significant relationship exists between a bivariate data set, and then calculate the confidence and predictive intervals. They also improve the interval-prediction capabilities by automating the process.
Vassar College
Vassar College: Multiple Regression
This is an interactive site allowing the student to input data (one dependent and three independent variables) and then letting the computer calculate the regression between these multiple forces.
TeachEngineering
Teach Engineering: Linear Regression of Bmd Scanners
Students complete an exercise showing logarithmic relationships and examine how to find the linear regression of data that does not seem linear upon initial examination. They relate number of BMD scanners to time.
Other
Magoosh: Statistics Fundamentals
An online course on the fundamentals of statistics including video lessons in Mean, Median, and Mode; Weighted Averages; Quartiles and Boxplots; Range and Standard Deviation; Normal Distribution; Z-scores; Intro to Inferential...
University of Baltimore
University of Baltimore: Alternative Approach for Estimating a Regression Line
A quick, three-step approach to estimating the regression line of a set of data known as the "distribution-free method." Written by Dr. Hossein Arsham
Texas Instruments
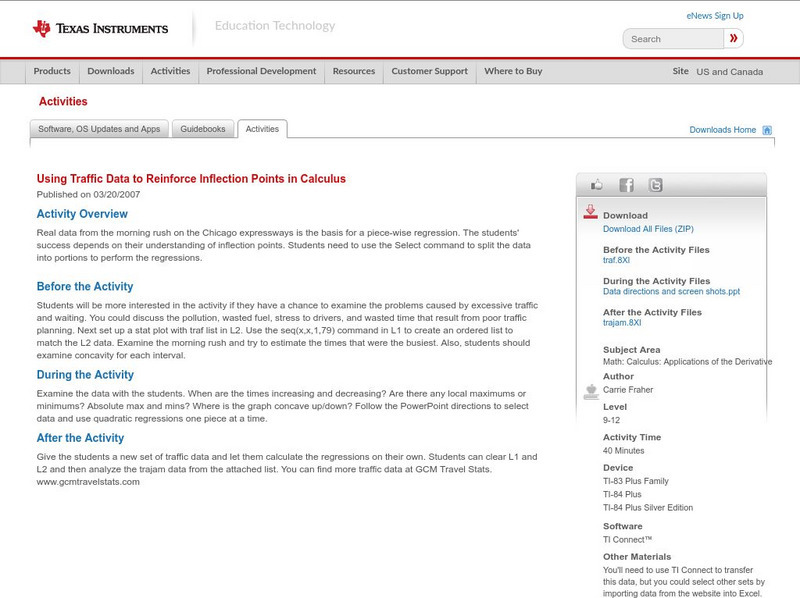
Texas Instruments: Using Traffic Data to Reinforce Inflection Points in Calculus
Real data from the morning rush on the Chicago expressways is the basis for a piece-wise regression. The students' success depends on their understanding of inflection points. Students need to use the Select command to split the data...
Texas Instruments
Texas Instruments: Using Cbr and Ti Navigator to Create a Regression Equation
In this activity, students generate data points using the CBR and store them as lists. Then, transfer the lists to the Activity Center to be graphed. The students will attempt to come up with a suitable regression equation.
Texas Instruments
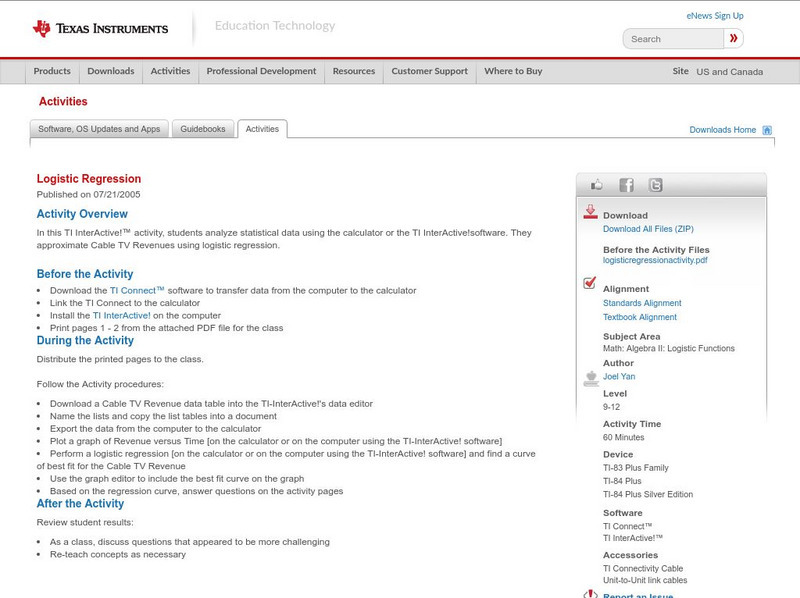
Texas Instruments: Logistic Regression
In this TI InterActive! activity, students analyze statistical data using the calculator or the TI InterActive!software. They approximate Cable TV Revenues using logistic regression.
Texas Instruments
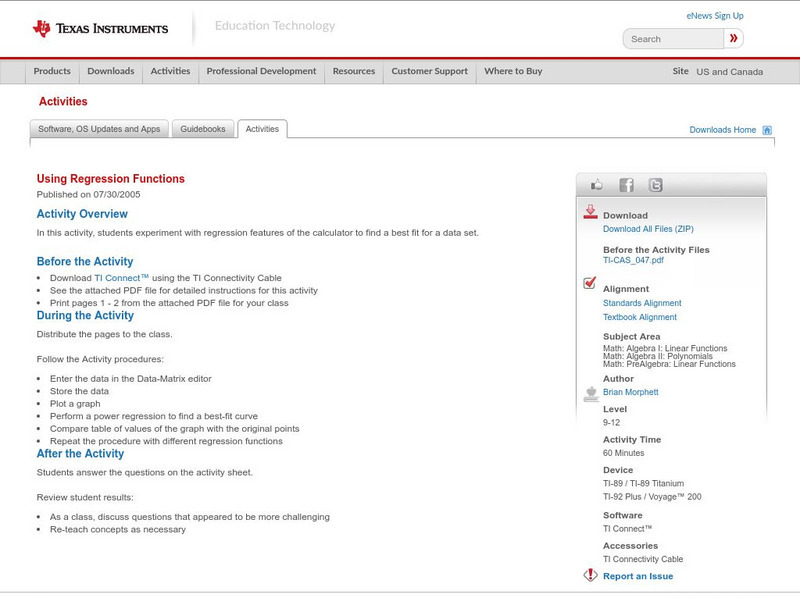
Texas Instruments: Using Regression Functions
In this activity, students experiment with regression features of the calculator to find a best fit for a data set.
Texas Instruments
Texas Instruments: Fitting an Equation to Bivariate Data
In this activity, students fit a linear least-square regression line to population data. They explore various functions to model the given data.
Texas Instruments
Texas Instruments: Exploring Bivariate Data
Students graph scatter plots and understand the concepts of correlation and least-squares regression. They also perform transformations to achieve linearity in the data plot.
Texas Instruments
Texas Instruments: Use the Regression Feature to Find a Line of Best Fit
This tutorial shows you how to enter a set of data and find the line of best fit.
Texas Instruments
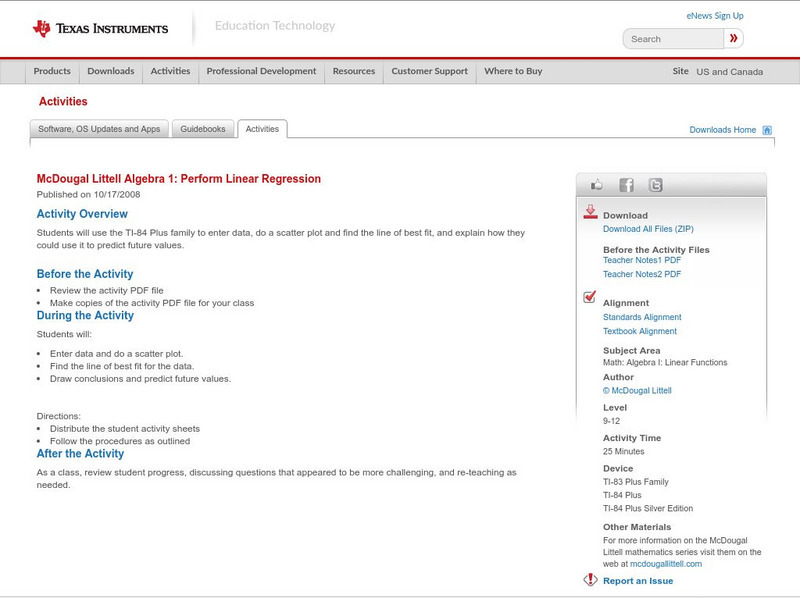
Texas Instruments: Mc Dougal Littell Algebra 1: Perform Linear Regression
Students can use the TI-84 Plus family to enter data, do a scatter plot and find the line of best fit and explain how they could use it to predict future values.
Texas Instruments
Texas Instruments: Special Cases of Normally Distributed Data
Students perform single and two-sample t procedures to investigate special cases of normally distributed data. They explore inference for a least-square regression line, including the confidence interval.
Wikimedia
Wikipedia: Linear Regression
Wikipedia explains the statistics term, "linear regression." Includes table of contents, hyperlinked terms, and formulas.
Texas Instruments
Texas Instruments: Exponential Regression
In this activity, students perform exponential regression on a data set.
University of South Florida
Fcat: Bungee M&m's: Teacher Notes
Students will learn how to draw a line of best fit for a set of data using m&m's and a "Bungee."
University of South Florida
Fcat: Shaq's Hand/foot Span: Teacher Notes
Students compare their own hand/foot span to Shaquille O'Neal's, then graph the data & construct a best-fit line. They can then use the information to investigate the proportionality of the human body.
Texas Instruments
Texas Instruments: Numb3 Rs: Mapping Fireprints
Based off of the hit television show NUMB3RS, this diverse lesson has students perform linear regression analysis (to compare two fire variables), check three-dimensional points using a planar equation, and evaluate points to determine...
Texas Instruments
Texas Instruments: Identifying Types of Correlation From a Graph and Calculator
Students will identify different types of correlations graphically and by using the linear regression analysis obtained from a TI-84 Plus calculator. Students will also obtain and know the significance of a correlation coefficient as a...
ClassFlow
Class Flow: Fitting Models to Data
[Free Registration/Login Required] A basic premise of science is that much of the physical world can be described mathematically and many physical phenomena are predictable. This scientific outlook took place in Europe during the late...


