Hi, what do you want to do?
Curated OER
Relating Distance and Velocity Over Time
Students calculate the distance and velocity over time. In this algebra lesson plan, students graph a linear function to represent the distance vers time travel. They interpret their graphs and draw conclusion.
Curated OER
Don't Let Parabolas Throw You
Young scholars identify relation, function, patterns and range. In this algebra lesson, students factor and graph quadratic equations. They use transformation to move the parabola around and make predictions.
Curated OER
Leap Into Exponential Functions
Studens identify the properties of exponents. In this algebra lesson plan, students grapha nd solve equaitons of exponential functions. They add, subtract, multiply and divide using exponents.
Curated OER
Leap Into Exponential Functions
Pupils use properties of exponents to solve equations. For this algebra lesson, students add, subtract, multiply and divide exponential functions. They graph and differentiate between exponential growth and decay.
Curated OER
Functions Made Easy
Students explore concept of functions as relationships, as machines, as equations, and as graphs.
Curated OER
Risky Business
Students view a video on AIDS, HIV and the ways in which HIV is spread. They discuss ways to avoid contracting HIV and participate in a simulation that shows the growth of a communicable disease.
Curated OER
Who Does the Lottery Benefit?
Students investigate the pros and cons of the lottery. In this algebra instructional activity, students use the formulas for permutation and combination to test their arguments about the lottery. They collect data about their argument...
Curated OER
The Kangaroo Conundrum: A Study of a Quadratic Function
Students play a game and collect data for their graph. In this algebra instructional activity, students solve quadratic equations and identify properties of their graph. They describe the pattern created by the graph and the game.
Curated OER
Coulomb's Law
Pupils solve problems involving electric charges and force. In this physics lesson plan, student solve word problems using addition and subtraction of vectors. They identify the direction represented by a vector as it relates to an...
Curated OER
A Functional Housing Market
Students access the Internet to search for housing prices in Houston, Texas,(the location can be changed to accommodate any location) and compare the prices to the number of square feet found in the living area of a house.
Curated OER
Building Paper Bridges
Students construct a bridge that can hold 100 pennies. In this math lesson, students evaluate the strength of their bridges. They predict how much weight a bridge can hold based on its design.
Oswego City School District
Regents Exam Prep Center: Regression Analysis
A collection of lesson ideas, a practice activity, and teacher resources for exploring regression analysis.
Texas Instruments
Texas Instruments: Bacterial Growth and Regression
This activity gives students a set of data to perform a regression analysis. Students need to be able to read the data, perform a regression, and interpolate and extrapolate information.
Missouri State University
Missouri State University: Introductory Statistics: Linear Regression Models
Four examples which use the linear regression model in real-world applications. The site continues with discussion on how to correctly construct the regression model, how its results can be analyzed, and what can come from it.
University of Colorado
University of Colorado: Ph Et Interactive Simulations: Least Squares Regression
Create your own scatter plot or use real-world data and try to fit a line to it. Explore how individual data points affect the correlation coefficient and best-fit line.
Texas Education Agency
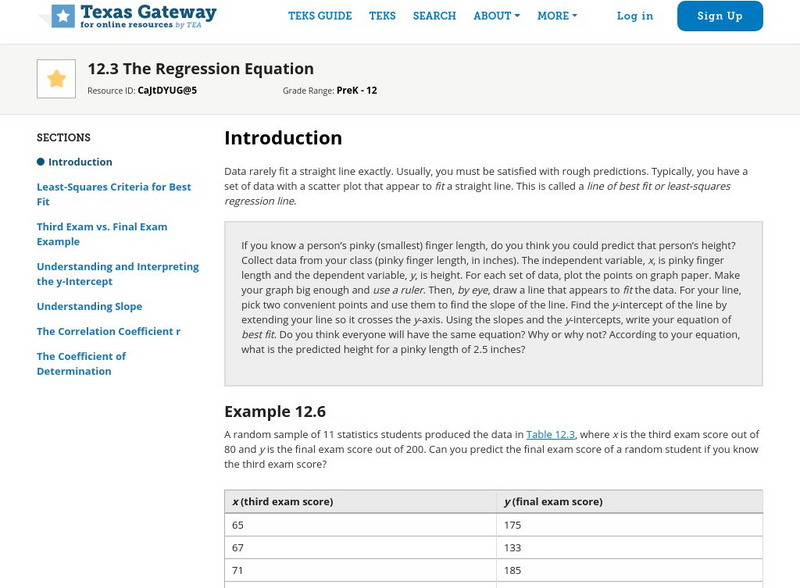
Texas Gateway: Tea Statistics: The Regression Equation
A tutorial on how to find the line of best fit or least-squares regression line for a set of data in a scatter plot using different methods and calculations.
Duke University
Duke University: Web Feats Ii: Lessons on Regression at Hessian
This site has several lessons on regression, "Designed to help students visualize topics associated with lines of regression, given a set of data points." Go to the teacher notes to find the objectives and standards which apply.
Texas Education Agency
Texas Gateway: Modeling Data With Linear Functions
Given a scatterplot where a linear function is the best fit, the student will interpret the slope and intercepts, determine an equation using two data points, identify the conditions under which the function is valid, and use the linear...
Khan Academy
Khan Academy: Linear Regression Review
Linear regression is a process of drawing a line through data in a scatter plot. The line summarizes the data, which is useful when making predictions.
Shodor Education Foundation
Shodor Interactivate: Regression
Plot a bivariate data set, determine the line of best fit for their data, and then check the accuracy of your line of best fit.
Other
Graph Pad: Data Analysis Resource Center
The GraphPad Statistics Guide is both a guide to doing statistical analyses with GraphPad Prism 7, and a concise review of statistical principles, emphasizing clear explanations with very little math. The GraphPad Curve Fitting Guide is...
Brown University
Brown University: Seeing Theory
This resource provides interactive visualizations of probability concepts. Covers basic probability, compound probability, probability distributions, frequentist inference, Bayesian inference, and regression analysis. The authors are...
National Council of Teachers of Mathematics
The Math Forum: Ask Dr. Math: Regression Method
This page goes over what regression method is and how a regression line fits in. Dr. MAth also suggests a book on regression if you are interested.
Texas Instruments
Texas Instruments: An Exploration of Direct Variation and Linear Regression
Students will use this activity for the following Algebra concepts: Review of Direct Variation; Properties of direct variations; Finding the constant of variations from data sets; Find missing values in data sets both numerically and...


