Curated OER
Stem and Leaf Plots
In this measures of central tendency worksheet, students study a stem and leaf plot pertaining to weekly low temperatures. Students use the plot to answer 6 questions. There will be a question that requires students to make their own...
Curated OER
Scatter Plots
In this scatter plots worksheet, students solve and complete 4 different problems. First, they use the table shown to model the relation with a scatter plot and trend line and to predict the value of a variable when given the other...
Curated OER
Make and use a Stem-and-Leaf Plot
In this stem-and-leaf plot worksheet, students use a given plot to solve 4 problems, then make a plot for given data and solve related problems. Houghton Mifflin text referenced.
Curated OER
My Test Book: Stem and Leaf Plots
In this math skills worksheet, students solve 10 multiple choice math problems which require they interpret a stem and leaf plot. Students may view the correct answers.
Curated OER
Scatter Plots
In this scatter plots worksheet, students solve and complete 6 different problems. First, they create a scatter plot to illustrate how weight and height are related and determine their relationship as positive, negative or no relation....
Curated OER
Plotting Points
In this coordinate pairs worksheet, students learn to plot points on a graph. Students study the examples and then complete 20 questions. This is intended as an online activity, but may be completed with pencil and paper.
Curated OER
Independent Practice 1: Plot Ordered Pairs
In this ordered pair worksheet, students plot given ordered pairs onto a coordinate plane. Ordered pairs contain both negative and positive numbers. Therefore, all four quadrants of the coordinate plane are used. This one-page...
Curated OER
Stem and Leaf Plots
In this stem and leaf plots worksheet, students solve and complete 10 different problems that include designing stem and leaf plots. First, they use the table on the left to determine the least score and the range of the total scores...
Curated OER
Plotting Coordinates on a Grid
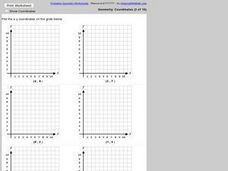
In this plotting points on a graph activity, students plot 6 points on 6 graphs. Students plot x and y-coordinates in the first quadrant.
Curated OER
Quiz: Scatter Plots and Line of Best Fit
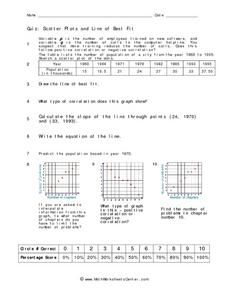
In this scatter plots and line of best fit activity, students create scatter plots from given sets of data. They answer questions concerning the scatter plot. Students write the equation of a line, identify the type of correlation...
Curated OER
Stem-and-Leaf Plots
In this stem-and-leaf plots worksheet, 8th graders solve and complete 3 different problems that include creating stem-and-leaf plots to solve problems. First, they determine the median, minimum, range and mode of the given set of numbers...
Curated OER
Fourteen Math Regent Exam Statistics Questions on Scatter Plots and Linear Regression
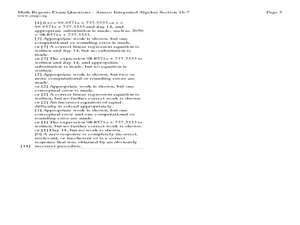
In this linear regression worksheet, students solve fourteen Math Regent Exam questions regarding scatter plots and linear regression. The solutions are provided.
Curated OER
Plotting Worksheet
In this plotting activity, students discuss the short term and long term problems of both the hero and the heroine. Students track the problems as they worsen and are ultimately resolved.
Curated OER
Box-and-Whisker Plots
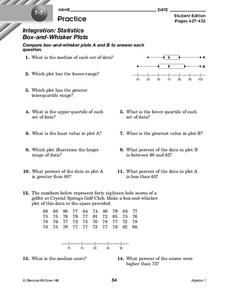
In this box-and-whisker plots worksheet, 9th graders solve and complete 14 different problems that include comparing various box-and-whisker plots. First, they determine the median for each set of data and plot the lesser range. Then,...
Curated OER
Data Analysis: Graphs, Charts, Tables, Statistics
In this data analysis worksheet, students interpret data in 5 problems involving graphs, tables, and scatterplots. Students construct 1 stem and leaf plot and find the mean, median, and mode of a data set.
Curated OER
Generate Measurement Data Word Problems
Plot data for three word problems, each with a table of data. Learners create line plots for these, all of which have only single-digit whole numbers. The large text and few number of problems make this ideal as a whole-class warm up....
Curated OER
Data Analysis
In this data analysis learning exercise, learners solve and complete 6 different problems that include using various types of data analysis. First, they create a stem-and-leaf plot of the ratios shown at the top and determine the mean,...
Curated OER
Generate Measurement Data Word Problems
Using a set of simple data, learners create a line plot to organize the information. This data includes only single-digit numbers and the highest number is six. Because the answer is explained and illustrated at the bottom, project this...
Curated OER
Discovering PI
In this pi activity, students identify and complete 4 different problems that include pi and graphing data points. First, they complete the chart at the top by measuring the diameter and circumference of each object. Then, students plot...
Curated OER
Template #1 A Lesson Before Dying Journal Reflections/Personal Statements
If you're working through A Lesson Before Dying, by Ernest J. Gaines, you might be interested in this resource. Pupils fill this page out after reading each chapter in order to create a short summary and clarify plot points and...
Illustrative Mathematics
Puppy Weights
Nobody can say no to puppies, so lets use them in math! Your learners will take puppy birth weights and organize them into different graphs. They can do a variety of different graphs and detail into the problem based on your classroom...
Curated OER
Choose a Graph to Display Data
In this math graphs learning exercise, students write line plot, tally chart, pictograph, or bar graph to tell the best kind of graph to use to answer the six questions.
EngageNY
Analyzing Residuals (Part 2)
Learn about patterns in residual plots with an informative math lesson. Two examples make connections between the appearance of a residual plot and whether a linear model is the best model apparent. The problem set and exit ticket...
Virtual Vine
Cat In the Hat Story Elements
Engage your pupils in a plot activity based on the favorite Dr. Seuss book, The Cat in the Hat. There are two pages included here. The first is a list of plot elements and the second is a grid of plot points and other information. Class...
Other popular searches
- Line Plots
- Plot Diagram
- Scatter Plots
- Line Plot Worksheets
- Stem and Leaf Plots
- Plot Structure
- Plotting Points on Graph
- Story Plot Diagram
- Elements of Plot
- Plot Development
- Box and Whisker Plots


