EngageNY
Displaying a Data Distribution
Pupils analyze a display of data and review dot plots to make general observations about the highest, lowest, common, and the center of the data. To finish, learners match dot plots to scenarios.
Curated OER
Hands On: Plot Points on a Coordinate Grid
In this solving coordinate grid word problem worksheet, learners plot points, order pairs, identify horizontal and vertical lines, and find distances to solve problems. Students solve six problems.
Curated OER
Scatter Plots
In this Algebra I/Geometry/Algebra II worksheet, students create a scatter plot and analyze the data to determine if the data show any type of correlation. The four page worksheet provides extensive explanation of topic, step-by-step...
Curated OER
Scatter Plots
In this statistics worksheet, 11th graders analyze different scatter plot graphs for positive, negative and no correlation. They graph their data and analyze it using scatter plots.There is 1 question with an answer key.
Curated OER
Lesson 6-7: Scatter Plots and Equations of Lines
In this scatter plot worksheet, students examine tables and write a linear equation that matches the table. Students graph linear equations. They read scatter plots, determine the trend line, and write a linear equation to match...
Curated OER
Madley Brath #39 - Stem and Leaf Plots, Mean, Median, Mode and Range
In this measures of central tendency worksheet, students draw a stem and leaf plot of a set of test scores. They compute the mean, median, mode, and range of the data set, and round the answers to the nearest tenth.
Curated OER
Line Plots - Homework 6.3
Elementary schoolers use data in a table to make a line plot, then answer five related questions. Houghton Mifflin text is referenced.
Mathematics Assessment Project
Temperatures
As a middle school assessment task, learners first examine line graphs of monthly temperatures for two locations, and then match box plots to each line plot.
Curated OER
Scatterplot
In this scatterplot worksheet, 9th graders solve and complete 7 different problems that include defining various scatterplots. First, they use the data plotted on the scatterplot that represent the best prediction. Then, students use the...
Curated OER
Stem-and-Leaf Plots
In this stem-and-leaf plots learning exercise, 9th graders solve and complete 9 various types of problems. First, they determine the mean, median, and mode of the stem-and-leaf plot shown. Then, students summarize the similarities and...
Raytheon
Scatter Plots
In this scatter plots learning exercise, students complete multiple choice questions about scatter plots having to do with money, free throws, exercising, and more. Students complete 8 problems.
Texas Instruments
Finding Linear Models Part III
Explore linear functions! In this Algebra I lesson, mathematicians graph data in a scatter plot and use a graphing calculator to find a linear regression and/or a median-median line. They use the model to make predictions.
Curated OER
Range, Mode, and Median
Fifth and sixth graders sort data from least to greatest and mark an X on the line plot to show how many of each number. Then they determine the range, mode, and median for the problem.
Curated OER
Coordinates
For beginning point plotters, these graphs give a good introduction. They examine a graph with shapes drawn onto it and each vertex labeled. There are 20 total, and scholars write the coordinates of each labeled point. All of these are...
Illustrative Mathematics
Puzzle Times
Give your mathematicians this set of data and have them create a dot plot, then find mean and median. They are asked to question the values of the mean and median and decide why they are not equal. Have learners write their answers or...
Curated OER
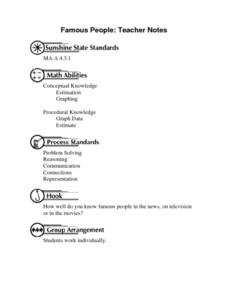
Famous People: Teacher Notes
Young statisticians practice creating scatter plots. First, they estimate the age of 14 people. Next, they write down the estimate in a table labeled x. Then write down their actual age in the table labeled y. Using these x and y...
Curated OER
What Makes a Novel a Novel?
They always say to write what you know. This approach is used to get middle schoolers prepared to write novels of their own. Using a favorite book as a model, potential novelists respond to prompts that ask about characters, plot, main...
Curated OER
Graphing Ordered Pairs
Are you working on graphing ordered pairs in your class? In this worksheet, learners, after looking over and studying how to graph ordered pairs, plot points on a coordinate grid and connect the dots. Class members also identify what...
Curated OER
Data Collection and Presentation
Middle and high schoolers collect and analyze data from four different activities. The activities include information about classmates, tallying colors of cars in a parking lot, stem and leaf plots, and making a histogram from winning...
Curated OER
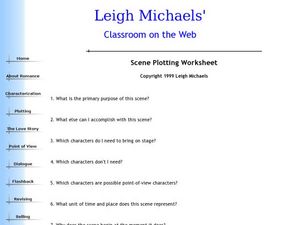
Scene Plotting Worksheet
Think about literary elements, characters, and point-of-view. Then click on this link to have your class answer 14 questions intended to solidify, test, or review their understanding.
PB Works
The Cay by Theodore Taylor
Record the plot elements of The Cay on this worksheet. Pupils note basic information about the book and answer questions about the introduction, point of view, character, conflict, rising action, climax, falling action, and resolution of...
Curated OER
Representing Data 2: Using Box Plots
What information can be gleaned from a box and whiskers plot? Discuss the five summary values - minimum, maximum, upper and lower quartiles, and median - and what conclusions can be made from these values? Included here is a matching...
Curated OER
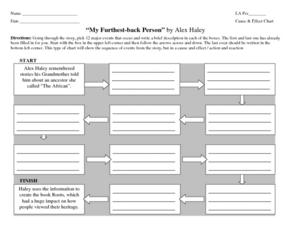
Cause & Effect Chart: "My Furthest-Back Person" by Alex Haley
Help your class see the connection between events in Alex Haley's story "My Furthest-Back Person" with this awesome graphic organizer. Individuals write a brief description of 10 major plot events in a series of boxes. The first and last...
Curated OER
Ordering Stories
What happened first? Learners examine four sets of images to sequence events using ordinal numbers. There is an example to get them started, and the first two have three pictures to organize. The final story is more challenging with four...
Other popular searches
- Line Plots
- Plot Diagram
- Scatter Plots
- Line Plot Worksheets
- Stem and Leaf Plots
- Plot Structure
- Plotting Points on Graph
- Story Plot Diagram
- Elements of Plot
- Plot Development
- Box and Whisker Plots


