Open Text Book Store
Arithmetic for College Students: Worksheets
Loaded with concepts ranging from multiplying decimals to converting units to solving problems using the order of operations, a thorough practice packet is perfect for a fifth or sixth grade math classroom.
Virginia Department of Education
Graphs
Examine different types of graphs as a means for analyzing data. Math scholars identify the type of graph from a series of data displays and then develop questions to match each one. Then, given a scatter plot of height versus age data,...
Pace University
Grade 7 Earth Day Statistics with Circle and Bar Graphs
Take a tiered approach to studying waste. The lesson uses Earth Day to present differentiated instruction around using circle and bar graphs. Each group gets a cube based on their tiers and works collaboratively as well as individually...
Newspaper Association of America
By the Numbers: Mathematical Connections in Newspapers for Middle-Grade Students
A cross-curricular resource teaches and reinforces mathematical concepts with several activities that use parts of a newspaper. Scholars use scavenger hunts to find the different ways math is used in the paper along with using data...
Curated OER
Usage and Interpretation of Graphs
Students explore graphing. In this graphing lesson, students predict how many shoe eyelets are present in the classroom. Students count eyelets and work in groups to organize and chart the data collected. Students put all the data...
Curated OER
Graphing
Students collect data to create different types of graphs-line, pie, and bar graphs. They use StarOffice 6.0 to create graphs.
Curated OER
Graph Club 2.0 Matching
Second graders study graphing using pictographs and bar graphs. They graph pie charts, line graphs, and also change the graph scale up to 1000. They use the pictograph on the left to create the same graph on the right using a bar graph.
Curated OER
Math--Fractions and Percentages
In this fractions and percentages learning exercise, students write down the percentages of a pie chart and change then into fractions. Students change 7 fraction sentences into a percentage sentence.
Curated OER
Equal Parts
In this equal parts worksheet, learners, working with a partner, study, formulate and calculate the answers to six word problems or drawings.
Curated OER
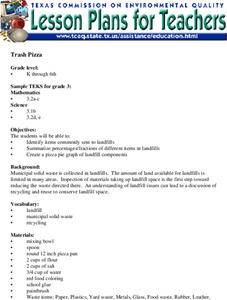
Trash Pizza
Students work together to identify items sent to landfills. They summarize percentages of the different items found in landfills. They create a pizza pie graph of all of the components found in landfills.
Curated OER
Equivalent Fractions
In this equivalent fractions worksheet, students learn equivalent fractions by learning the method of splitting the pieces. Students then use the pie charts to help them connect equivalent fractions and then complete exercises that have...
Agriculture in the Classroom
Pumpkins... Not Just For Halloween
Celebrate fall with four pumpkin themed hands-on activities! After learning about pumpkins, scholars complete two activity sheets that reinforce estimation and word problems. They then plant pumpkin seeds and bake a pie in a bag.
Curated OER
Activity: An Experiment with Dice
Roll the dice with this activity and teach young mathematicians about probability. Record outcomes for rolling two number cubes in order to determine what is most likely to happen. Graph the data and investigate patterns in the results,...
Curated OER
Graphing Using Cookies
Pupils differentiate between bar graphs, line graphs, pictographs and bar graphs. After participating in a hands-on cookie activity, students label and draw their own graphs.
Curated OER
Data Analysis
Pupils double check their data collections of Top 20 singles that they've been collecting for several days. Types of data is reviewed in detail and a variety of questions are asked for retention factors of mastery. They draw a tally...
Curated OER
Grasping Graphs
For this grasping graphs worksheet, students solve and complete 3 different types of problems. First, they graph the data described and select the appropriate graph type. Then, students identify the independent and dependent variable. In...
Curated OER
Data Handling
In this data handling learning exercise, students explore multiple ways to represent data. They create stem and leaf plots, histograms, and bar charts. Students examine and interpret diagrams and statistics. This eleven-page learning...
Curated OER
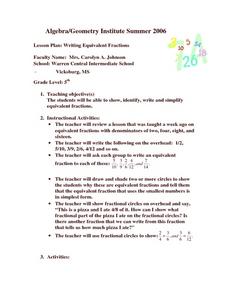
Writing Equivalent Fractions
Fifth graders work to find the fractions that are equal to one another. They use a visual pie graph to show different values. Students are able to see how fractions can look different, yet have the same value.
Curated OER
Budget It!
In this managing money worksheet, young scholars record all their families expenses and draw a pie chart showing how much money goes where. Students express the importance of planning how to spend money on the lines provided.
Curated OER
Completing Frequency Diagrams from Displayed Data
In this frequency diagram worksheet, students use a bar chart, stacked bar chart and pie chart to complete frequency tables. A reference web site is given for additional activities.
Curated OER
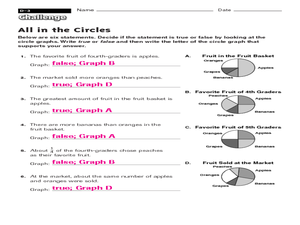
All in the Circles
In this circles activity, students use 4 circle/pie chart graphs to answer a set of 6 questions. Answers are included on page 2.
Curated OER
Circle Graph-Fractions
In this circle graphs worksheet, students determine what fraction of a pie graph is a designated color. Answers are included on page 2.
Curated OER
Using Spreadsheets and Graphs
Third graders explore mathematics by utilizing computers. In this graphing lesson, 3rd graders gather class data based on a particular topic such as the "favorite candy" of the class. Students utilize this information and computers to...
Curated OER
Charts and Graphs
Fifth graders interpret data into graphs and percentages. In this organizing data lesson plan, 5th graders discuss bar, circle and line graphs. Students complete bar graph and apply probability using the results.
Other popular searches
- Pie Charts and Graphs
- Interpreting Pie Charts
- Fraction Circles Pie Chart
- Circle Graphs Pie Charts
- Energy Pie Chart
- Reading a Pie Graph
- Creating a Pie Chart
- Bar Graphs, Pie Charts
- Pizza Pie Graph
- Nutrition Facts Pie Graph
- Pie Chart Activity
- M&m Pie Chart


