Curated OER
Frequency Tables; Discrete Ungrouped Data
In this frequency tables worksheet, students utilize given data to work out three frequency charts with one containing values and a pie chart involving angles for each value. Students complete three vertical line diagrams and check all...
Curated OER
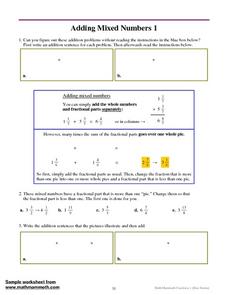
Adding Mixed Numbers 1
In this adding mixed numbers worksheet, students write addition sentences using pie charts, add mixed numbers with the same denominator, and write mixed numbers as fractions in simplest form. Students solve nine problems.
Curated OER
Froot Loops to the Max- Pie 2
In this Froot Loops to the Max worksheet, students solve 2 different problems related to graphing data with a box of Froot Loops cereal. First, they complete the circle/pie graph using the given data including a key and a title for their...
Curated OER
Jim, Tony, and Frank-The School Fund-raiser (Graphing)
In this graphing worksheet, students view a pie chart. Students use their graphing knowledge to interpret the pie chart and answer ten questions. There is an answer sheet.
Curated OER
Data and charts
In this data and charts worksheet, students answer multiple choice questions referring to different charts about mountain heights, breakfast drinks, and more. Students complete 10 multiple choice questions.
Curated OER
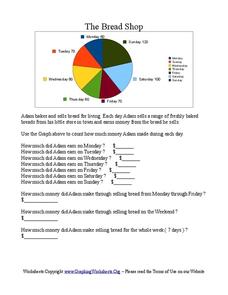
The Bread Shop
In this pie chart worksheet, students use the pie chart graph to count the money Adam made in the Bread Shop. Students complete 10 questions.
Curated OER
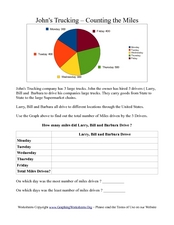
John's Trucking- Counting the Miles
In this graphs worksheet, students analyze a pie graph showing miles driven by three truck drivers in a week. Students fill out a chart in which they calculate total miles driven.
Curated OER
Understanding Fractions
In this recognizing fractions worksheet, students observe explanations and examples of pie charts and bars and use them to color, write the fraction of the shaded part, and draw and color pie charts. They will solve thirty-two problems.
Curated OER
Interpreting Circle Graphs
What does this pie chart mean? Once scholars can analyze a circle graph on a basic level (i.e. "Most people prefer cats"), it's time to delve deeper into it. They examine two graphs here, and are given the total number of participants...
Curated OER
Data Handling
In this data handling worksheet, 6th graders solve and complete 4 various types of problems. First, they draw a bar chart to represent the information provided in the table shown. Then, students show beneath the table how to work out the...
Curated OER
Statistical Inquiry
In this statistical inquiry worksheet, students analyze and interpret a variety of diagrams such as a scatter plot, bar graph and pie charts. They create tables and other diagrams to support given data. This two-page worksheet contains 3...
Curated OER
Histograms and Statistical Graphics
In this statistics worksheet, students solve 6 data problems. They construct a histogram of given data, they create a frequency polygon, and a stem and leaf diagram. Students create a dot plot and a pie chart for given data sets. On the...
Curated OER
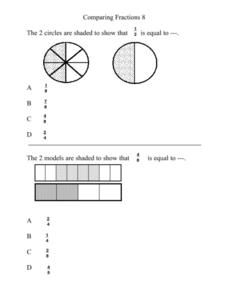
Comparing Fractions 8
In this elementary math worksheet, 5th graders compare fractions using a pie chart and practice finding the values in the multiple choice format.
Curated OER
Problem-Solving Decisions: Choose the Operation: Problem Solving
In this math operations activity, students solve the word problem using the pie chart and following the steps of understand, plan, solve, and look back. Students then answer a final question by choosing the operation and solving.
Curated OER
Data Analysis
In these analyzing data worksheets, learners complete a table and a pie chart and calculate mean, median, mode, and range for sets of data.
Curated OER
Fill in the Graphs
In this graphing information activity worksheet, students use the 6 provided clues to appropriately fill in the blanks in a pie chart.
Curated OER
Data Handling
In this data handling worksheet, students interpret data found in table, graphs and charts. They organize data and draw bar charts. This two-page worksheet contains 2 multi-step problems.
Willow Tree
Circle Graphs
Pie isn't just for eating! Scholars learn to create pie charts and circle graphs to represent data. Given raw data, learners determine the percent of the whole for each category and then figure out the degree of the circle that percent...
Virginia Department of Education
May I Have Fries with That?
Not all pie graphs are about pies. The class conducts a survey on favorite fast food categories in a lesson on data representation. Pupils use the results to create a circle graph.
Curated OER
Cindy and Linda - Selling Lemonade
In this pie charts activity, students use the pie chart to count how many glasses of Lemonade were sold by Cindy and Linda. Students complete the table and answer 3 questions.
Curated OER
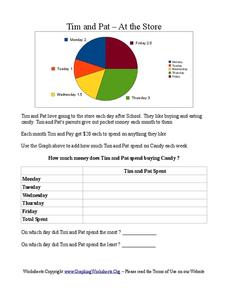
Tim and Pat - At the Store
In this pie chart worksheet, students use the pie chart to add the amount of time Tim and Pat spend buying candy each day of the week. Students answer 2 questions about the table.
Math Mammoth
Multiplying Fractions by Fractions
A four-page resource walks learners through the basics of multiplying fractions. The handout is very visual with many diagrams in various colors. By the end of the lesson, learners are given an opportunity to multiply whole numbers with...
Curated OER
Collecting Data
In this data collection instructional activity, learners read about how data is collected and organized. They also learn about a hypothesis. Students read through examples of different charts and then answer 23 questions pertaining to...
Curated OER
Let's Go Shopping
In this fraction and pie chart instructional activity, students draw a line from the toys with the prices of 50 cents, 75 cents, and 25 cents to the pie chart that show the part of a dollar the toy costs.
Other popular searches
- Pie Charts and Graphs
- Interpreting Pie Charts
- Fraction Circles Pie Chart
- Circle Graphs Pie Charts
- Energy Pie Chart
- Reading a Pie Graph
- Creating a Pie Chart
- Bar Graphs, Pie Charts
- Pizza Pie Graph
- Nutrition Facts Pie Graph
- Pie Chart Activity
- M&m Pie Chart


