Curated OER
Halloween Candy/ Sugar Content
Fourth graders examine the amount of sugar contained in Halloween candy by looking at nutritional labels from candy bars. They figure out ways to encourage people to reduce the amount of sugar they eat at this holiday. They look at the...
Curated OER
Breakfast Cereal - How Nutritious Is Yours?
Young scholars analyze the nutritional value of breakfast cereal in order to make an informed choice. They create a stem and leaf plot which analyzes the nutritional value of the cereal they eat on a regular basis. Students write a...
Curated OER
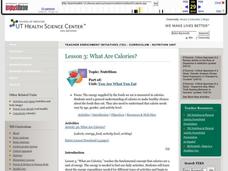
What Are Calories?
Learners examine calories for the human body. In this calorie instructional activity, students explore the energy expenditures needed for different types of activities and how many calories are needed to support daily functions.
Curated OER
The Dentist
Students read a short story about visiting a dentist. Then they use toothbrushes in order to demonstrate the correct way to brush teeth. Students use the internet to investigate how some foods are healthier for teeth than others. Then...
Curated OER
Goobers. Goobers? Goobers!
Learners begin the lesson by noting the many ways in which to use peanuts. In groups, they use the internet to research the work of George Washington Carver. They discover the allergies and nutritional information of the peanut and...
Curated OER
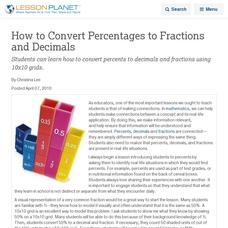
How to Convert Percentages to Fractions and Decimals
Students can learn how to convert percents to decimals and fractions using 10x10 grids.
University of California
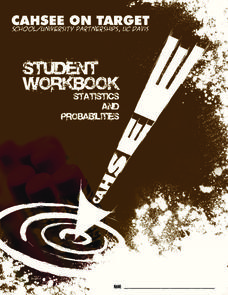
Student Workbook: Statistics and Probability
Statistically, practicing this packet completely helps young mathematicians do well on the test. The packet is adaptable to many grade levels as it includes basic probability and goes up to data analysis with mean, median, and mode.
Curated OER
The Food Guide Pyramid
Students examine each level of the food pyramid and how many servings they should consume during the day. They study the important nutrients associated with each category of the food pyramid.
Achieve
Ivy Smith Grows Up
Babies grow at an incredible rate! Demonstrate how to model growth using a linear function. Learners build the function from two data points, and then use the function to make predictions.
Curated OER
Graphing the Annual Food Drive
Students graph the number of items contributed to the food drive. They compare daily results to other days or to an overall goal and answer questions based on the graph.


