PwC Financial Literacy
Finanacial Responsibility and Decision Making: Personal Information and Identity Theft
Elementary schoolers look into the very real, and scary, practice of identity theft. They discover the main techniques used by people who steal other people's identity. Learners produce an identity theft tip sheet and share their tips...
Curated OER
M & M Madness
Students work with the mathematics unit of collection, organization, and presentation of data. In this math and technology lesson plan, students use Valentine M & M’s and The Graph Club to sort and graph the various colored M & M’s.
Curated OER
Polluting the Environment
Fourth graders construct mini-ecosystem, pollute the ecosystem, observe, collect, and record data on the effects of these pollutants on their ecosystem, organize data on spreadsheets, create graphs, and design presentations to share with...
Curated OER
Wacky Water World: Student Worksheet
In this math worksheet, students will work alone or in pairs to determine which theme park ticket package is a better deal. Students will use data provided in the worksheet and a graphing calculator to make the decision.
Curated OER
Can You Guess The Flavor?
Second graders conduct a tasting experiment. In this senses lesson, 2nd graders read The Five Senses and brainstorm different tastes. They work in pairs, one blindfolded and the other recording. The blindfolded student eats one skittle...
Curated OER
Chain Across the Hudson Lesson Plan A - Locating the Chain
Pupils read a letter from George Washington requesting them to identify on a map a location that would stop the advance of British warships. They choose a location and justify their choice.
Curated OER
The Weather Around Us
First graders explore weather patterns. In this weather lesson, 1st graders research the daily weather by creating a graph of the daily weather conditions. Students use the computer to access information regarding the weather forecast....
Curated OER
THIS WEEK'S WEATHER
First graders create a picture graph representing their town's weather for one week.
Curated OER
How Would You Spend a Million Dollars?
Students plan and organize a theme to spend one million dollars. They select a theme, research prices of items on the Internet, organize the information into a spreadsheet, write an introductory paragraph, and create a final project.
Curated OER
Mean, Median, and Mode
Students calculate measures of central tendency. in this mean, median, and mode lesson, students calculate the measures of central tendency. They organize data, examine and explain the statistics.
Curated OER
Million Dollar Project
Each student is given the task of spending $1 million. The way students spend their money is dependent on a theme such as "creating a dream world," "taking a trip," or "doing something to better society." Each student researches,...
Curated OER
Party, Party, Party
Second graders conduct investigations with counting, comparing, organizing, analyzing, displaying and interpreting data. They pose questions for investigation and collect the data. Students display the data in tally charts, uniform...
Curated OER
Find the Epicenter
Eighth graders visit the Virtual Earthquake Web site and complete activities that demonstrate how geologists locate the epicenters of earthquakes. The site uses actual data from historic earthquakes.
Curated OER
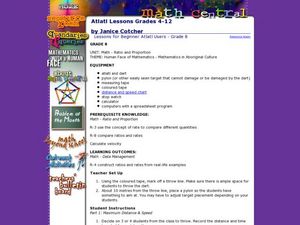
Atlatl Lessons Grade 4-12
Students experiment with velocity, ratios, and rates. In this data management lesson plan, students throw a dart with and without using an atlatl and collect and record various data. Students construct ratios based on the data and...
Curated OER
KEEP ON TRUCKING
Young scholars comprehend and apply concepts of data analysis and distributions by observing modes of transportation for food and fiber products. They are given an activity sheet "On the Lookout for Agriculture." Students discuss the...
Curated OER
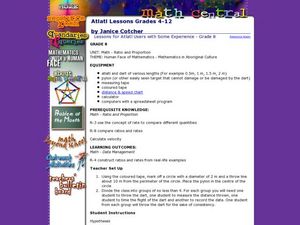
Atlatl Lessons for Grade 8
Eighth graders explore the weapons of the Aboriginal people. In this eight grade math/science lesson, 8th graders collect and analyze data regarding the speed and distance of a dart thrown with an atlatl. Students choose the...
Curated OER
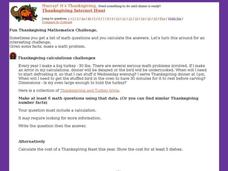
Thanksgiving Internet Math Fun
In this Thanksgiving Internet math fun worksheet, learners interactively choose from 16 different activities with links to other websites, all with a Thanksgiving and math theme.
Curated OER
What are the Chances: A Game of Chance!
Sixth graders experiment with dice, playing cards, pennies and computer-generated simulations to calculate probability. They use compiled data to make predictions.
Curated OER
Creating a Graph
Students brainstorm favorite things to do during the summer. They survey classmates to collect data, arrange it in a chart, and create graphs using ClarisWorks.
Curated OER
Biospheres in Your Backyard
Pupils collect data from a local river biome. They use the information for metric conversion and graphing equations. They study the components of what makes up a biosphere and how math is used to analyze one.
Curated OER
Graphosaurus
Students complete bar graphing activities with a dinosaur theme. Students discuss their favorite dinosaurs, collect data about the discussion, and make a floor graph of the information. Students complete a dinosaur graph worksheet.
Curated OER
M & M Madness
Second graders graph M & M's by color. For this graphing lesson plan, 2nd graders first predict how many of each color they think are in a handful of M & M's. Then they graph the amounts of each color on a computer program....
Curated OER
Compare Your Air
Students will compare the data for different locations that they select and investigate trends over the course of a number of years. This will give the students an opportunity to apply statistical measures (mean, median,mode) to data...
Curated OER
Data Collection Project
Young scholars collect data using email. They calculate the mean, median, mode, range and outliers. They create a graph using the data results. They write five paragraphs to summarize their data.
Other popular searches
- Literary Analysis Plot
- Literary Analysis Paper
- Literary Analysis for Poetry
- 9th Grade Literary Analysis
- Literary Analysis on Quotes
- Writing Literary Analysis
- Literary Analysis the Hobbit
- Test for Literary Analysis
- Literary Analysis Pocahontas
- Writing a Literary Analysis
- Literary Analysis Essay
- Literary Analysis Plays


