Curated OER
Symmetry Using Polygons
Working on symmetry in your class? If so, this instructional activity might be for you. Learners observe different triangles and quadrilaterals, determine which are symmetrical, draw in the lines of symmetry, and color the symmetrical...
Curated OER
Tracing Highs and Lows in San Francisco
On a topographic map, students identify the scale bar, north arrow, and contour interval. They then locate a hill on the map and make note of the contour lines. Students then locate other places with similar contour line patterns....
Curated OER
Facial Symmetry
Learners study facial symmetry. They explore lines of symmetry, and create illustrations with multiple lines of symmetry.
Curated OER
Everyday Heroes You Can Be One, Too
Students listen to a read aloud of Alan Baker's, White Rabbit's Color Book while identifying shapes and lines throughout the book. They use shapes and different types of lines to create a bunny of their own. They must use five shapes to...
Curated OER
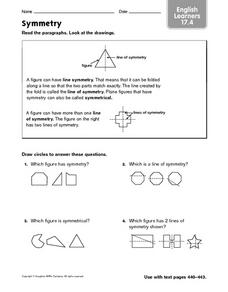
Symmetry - English Learners 17.4
Upper graders solve four multiple choice problems where they determine if figures are symmetric and determine lines of symmetry.
Curated OER
Ruler and Compass Constructions
Fourth and fifth graders examine how to construct perpendicular lines and to bisect angles using rulers and compasses in this unit of lessons. They design a number of polygons using these methods.
Curated OER
Similar Situations
Students explore intersecting lines. In this intersecting lines lesson, students investigate shapes consisting of parallel, perpendicular, and similar lines. Students investigate these lines in shapes around them.
Curated OER
Pizza Possibilities
Students create and interpret line plots, bar graphs, and circle graphs. The lesson assumes mastery of conversions from fraction to decimal to percent, construction of angles, and at least an introduction to graphs displaying data.
Curated OER
All in the Family
Students use data to make a tally chart and a line plot. They find the maximum, minimum, range, median, and mode of the data. Following the video portion of the lesson, students will visit a Web site to test their data collection skills...
Curated OER
Treble Clef Sign
Students explore and explain the purpose of the lines and spaces. They associate up and down on the staff with higher and lower pitches on the piano. Students recall that the G clef touches 5 lines and has 4 spaces.
Curated OER
Plugging Into The Best Price
Examine data and graph solutions on a coordinate plane with this algebra lesson. Young problem-solvers identify the effect of the slope on the steepness of the line. They use the TI to graph and analyze linear equations.
Curated OER
Fire!, Probability, and Chaos
Upper elementary and middle schoolers work with the concept of probability. They are introduced to the concept of chaos. Learners graph and analyze using a line plot, work with mean, and are introduced to the concept of variance.
Curated OER
Cloudy vs. Clear
Students analyze line plots. For this weather lesson using real NASA data, students discuss how weather affects the way the Earth is heated by comparing different line plots.
Curated OER
Countdown Challenge: Live Symmetry in Regular & Irregular Polygons
In this symmetry worksheet, students identify lines of symmetry in given polygons. They discover the correlation between the number of sides and the number of lines of symmetry. Students determine the lines of symmetry in irregular...
Curated OER
Interpreting and Displaying Sets of Data
Learners explore the concept of interpreting data. In this interpreting data lesson, students make a line plot of themselves according to the number of cubes they can hold in their hand. Learners create their own data to graph and...
Curated OER
Generate Measurement Data Word Problems
Bar and line graphs are an excellent way to visually analyze data: give your scholars practice both analyzing graphs and creating their own! First, they examine five basic bar graphs, indicating the number of squares on specific days....
Curated OER
Survey Says...
Young learners create and implement a school-wide survey about student body favorites! Learners record and analyze the data on a bar graph, picture graph, and line graph, and then display the data. Then, wrap it all up with a celebration...
Curated OER
Making a Pinhole Camera
Students are introduced to the basic straight line pattern of travel that light takes. A cereal box and wax paper provide the pinhole camera that captures the light's inverted image. Shifting this pattern provides additional challenges.
Curated OER
Linear Modelling of the Life Expectancy of Canadians
Middle and high schoolers explore the concept of linear modelling. In this linear modelling lesson plan, pupils find the line of best fit for life expectancy data of Canadians. They compare life expectancies of men and women, and...
Curated OER
The Hudson's Ups and Downs
Even rivers have tides. Older elementary schoolers will discuss the Hudson River and how weather, water craft, and the ocean cause tidal fluctuation. They will examine a series of line graphs that depict tidal fluctuation, then analyze...
Curated OER
Connect the Animal to its Food
What kind of food does a monkey eat? If you know, then you'll be able to complete this worksheet. To practice drawing a straight line, learners draw to connect the animal to its food. A total of five lines will be drawn from right to left.
Curated OER
Draw What You Feel in the Bag: Art Game
Here is a great game to play on a rainy day or as a warm up. Kids feel an object in a paper bag, they do not attempt to identify it, they simply draw what they feel. This results in a contour drawing based on line, feeling, and texture....
Curated OER
Confusing Fractions and Decimals
Eight number lines are given, and math scholars need to place the given decimal numbers on the fraction line as accurately as possible. Each number line shows a different span of numbers. Consider having learners go through it the first...
Ohio Department of Education
Fraction Models - Grade Three
Explore fractions using different manipulatives and illustrations. Your class can create a variety of models of fractions and mixed numbers with drawings and manipulatives. They then work to compare fractions, mixed numbers, and whole...
Other popular searches
- Number Line
- Line Graphs
- Parallel Lines
- Linear Equations
- Geometry Lines
- Linear Measurement
- Line Symmetry
- Line Plots
- Lines of Symmetry
- Line Segments
- Assembly Line
- Graphing Linear Equations


