Curated OER
Senior Analysis
In this senior analysis activity, students solve and complete 10 various types of problems. First, they graph each function completely. Then, students label the axes and show a table for each. They also determine if the graph is a...
Curated OER
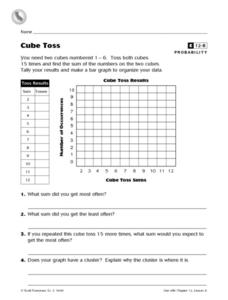
Cube Toss
In this probability and graphing worksheet, students solve 8 problems in which data from a cube toss is displayed on a table and graph. Students answer the questions about their results.
Curated OER
Decode Word Is..
Students solve problems using patterns. In this algebra activity, students identify the relation, domain and range of a function. They graph functions using coordinate pairs.
Curated OER
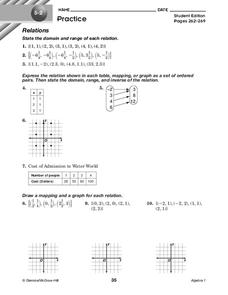
Relations
In this relations activity, 10th graders solve and complete 10 different problems that include defining various forms of relations. First, they state the domain and range of each relation. Then, students express the relation shown in...
Curated OER
Between The Extremes
Students analyze graphs for specific properties. In this algebra lesson, students solve equations and graph using the TI calculator. They find the different changes that occur in each graph,including maximum and minimum.
Curated OER
Algebra II Calculator Lab
In this quadratic functions worksheet, students use their graphing calculators to solve the 9 problems on the page. The questions ask students to graph functions, compare graphs, find the vertex and axis of symmetry and more.
Curated OER
Education for Global Peace
Fifth graders construct data graphs based upon sets of data. In this graphing instructional activity, 5th graders read the text If the World Were a Village and discuss how types of graphs accurately represent a large population. Students...
Curated OER
Eye Color
Students take a survey on eye color and plot their findings into a graph. In this eye color lesson plan, students take a class survey of everyone's eye color and learn how to put those findings into a graph.
Curated OER
Systems of Linear Inequalities
In this Algebra I/Algebra II activity, students solve systems of linear inequalities by graphing the inequalities on a coordinate plane and determining the location of all ordered pairs that solve the system. The three page activity...
Curated OER
Round and Round and Round We Go!
Students investigate motion using a CBL. In this algebra lesson, students collect and graph data on a coordinate plane. They define and identify amplitude and period of conic graphs.
Curated OER
Tune...Um!
Students collect real data on sound. In this algebra lesson, students use a CBL and graphing calculator to observe the graph created by sound waves. They draw conclusion about the frequency of sound from the graph.
Curated OER
Properties of Curves
For this Calculus worksheet, students use a graphing calculator to boost their understanding of functions and their graphs as they examine the properties of curves. The forty-two page worksheet contains one hundred problems. Answers...
Curated OER
Track Meet
In this reasoning worksheet, 3rd graders look over a table with statistics and solve the answers to 5 word problems related to the table about a class track meet.
Curated OER
Stem and Leaf Plots
In this stem and leaf plots worksheet, students solve and complete 10 different problems that include designing stem and leaf plots. First, they use the table on the left to determine the least score and the range of the total scores...
Curated OER
Finding a Line of Best Fit
Pupils engage in the practice of creating a scatter plot with the data obtained from measuring different resting heart rates. The data is used to create the table that is translated into a graph. The instructional activity gives...
Curated OER
Inequality Shading Investigation
In this inequality worksheet, students graph the inequality of a line. They list ten integer coordinates that lie on the grid. Students explore their findings and answer thought questions. They shade the graph to indicate answers. ...
Curated OER
Weather Report Chart
Young scholars complete a weather report chart after studying weather patterns for a period of time. In this weather report lesson, students measure temperature, precipitation, cloud cover, wind speed, and wind direction for a month....
Curated OER
Math Problem #1: Exhausting Fossil Fuel Resources
In this fossil fuel worksheet, students graph fossil fuel consumption from given information. Afterward, they estimate the annual rate of petroleum consumption and predict future consumption figures. In this one-page worksheet, there are...
Curated OER
Introduction to functions
In this functions learning exercise, students plot points on a graph according to the rule. Students plot 7 points on each of the 2 graphs given to them.
Curated OER
Algebra—Quadratic Equations and Functions
Students use given information on wind speed with the quadratic formula to determine the pressure of the wind on a building. In this quadratic equations lesson, students compute the pressure of the wind from two data tables. They graph...
Curated OER
Creating a Spreadsheet
Students create a spreadsheet using ICT. In this algebra lesson, students collect and graph their data using a spreadsheet. They find solution to a given problem using trial and error.
Curated OER
Graphing Calculator Investigation - Second Degree Polynomial Functions
Students solve quadratic functions. In this solving quadratic functions lesson, students determine the height of an object at a given time. Students determine the time at which an object hits the ground. Students answer questions...
Curated OER
Modeling Linear Relationships
Learners graph lines using the slope and y-intercept. In this algebra lesson, students create data using tables and equations. They use their data to make predictions and draw conclusion.
Curated OER
Highs and Lows
Solve problems using integration and derivatives. By using calculus, learners will analyze graphs to find the extrema and change in behavior. They then will identify the end behavior using the derivatives. Activities and handouts are...
Other popular searches
- Tables, Charts and Graphs
- Function Tables and Graphs
- Tables and Graphs
- Tables Charts and Graphs
- Create Data Tables From Graphs
- Math Tables and Graphs
- Reading Tables and Graphs
- Data Displays and Graphs
- Tables, Graphs, Charts
- Using Graphs and Tables
- Making Tables and Graphs
- Data Tables and Graphs


