Khan Academy
X and Y Intercepts 2
Given a linear equation in standard form, find the x-intercept and y-intercept. In this video, Sal shows how one can set x = 0 and solve the y-intercept, and how you can set y = 0 and find the x-intercepts.
Curated OER
How Do You Graph the Parent Quadratic Function y=x2?
Watch this video to learn about the parent quadratic function. The instructor walks learners through this step-by-step process.
Curated OER
What is a Parabola?
What do you get when you graph a quadratic function? Not a line, that's the graph of a linear equation. The graph of a quadratic function is a curved line, either opening upward like a smile, or opening downward like a frown. The...
National Education Association
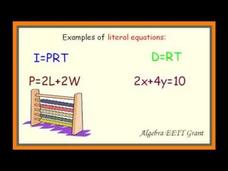
Solve Linear Formulas and Literal Equations for a Specified Variable
Mathematics is not a spectator sport. A video explains how to identify literal equations and why pupils will need to use them. It goes on to describe how to solve for a specified variable.
FuseSchool
Finding the Gradient of a Straight Line
Investigate the relationship between the gradient, or slope, of a line and its graph. Pupils learn to use a graph to calculate the slope of a line. The video lesson includes both positive and negative slopes and compares the steepness of...
Curated OER
How Do You Use a Scatter Plot to Find a Positive Correlation?
You can use a scatter plot to determine if there is a positive, negative, or no correlation between the given data. After graphing data you need to find a line of fit, a line that best represents the data you've graphed. It will be the...
Curated OER
What's a Scatter Plot?
Scatter plots refer to a graph of given data. Scatter plots offer a way to look at information and allows the observer to analyze and interpret possible meanings and trends of the given data. Predictions can often be made based on the...
FuseSchool
Parallel and Perpendicular Lines
Investigate parallel and perpendicular lines in the coordinate plane. Watch as the instructor demonstrates graphing the two types of lines. She highlights the patterns of the slope or steepness of the pairs of lines to make the concept...
Curated OER
Conic Sections: Hyperbolas 3
Continuing with the study of graphing hyperbolas, Sal shows an example of graphing a parabola that is centered at a point off the origin. By looking at the equation, first without shifting it, he helps listeners develop an intuitive...
Curated OER
Conic Sections: Hyperbolas 2
Here is an example in this video of graphing a hyperbola centered at the origin. First, Sal shows solving for the equations of the asymptotes and then shows how to determine the direction of the hyperbola. He takes the approach of not...
Curated OER
Overtaking Word Problem
These are the types of problems that cause many people to distress over algebra. In this video, Sal looks at a problem where three people, each at set distances apart, are traveling at different constant speeds. We need to know how long...
Khan Academy
SAT Prep: Test 4 Section 4 Part 4
Sal takes a little more time to explain the next two problems as he nears the end of this practice SAT session. He spends about 5 minutes drawing, solving, and discussing problem 17 (geometric line segments) and the next 5 minutes on...
Curated OER
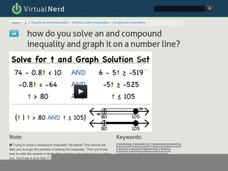
How Do You Solve an AND Compound Inequality and Graph It On a Number Line?
Solving a compound inequality is not as difficult as it might seem at first. Just break it apart and solve each side as an individual problem. See how to write these two solutions in set-builder notation. Then graph each inequality on...
National Education Association
Scatter Plots
What's my line, anyway? A video covers the aspects of finding an equation of the best-fit line for a set of data. It works through plotting the points to drawing a line that appears to represent the data. The presenter suggests finding...
Teacher's Pet
Direct and Inverse Relationships
How can your class determine the relationship between experimental data? Learners discover how to express direct and inverse relationships through examples and sample problems in a video. The narrator takes data from tabular to graphical...
Curated OER
What Does it Mean To Have No Correlation?
What does it mean when a scatter plot graph shows that there is no correlation? Does it have something to do with the slope of the line of fit? Yes, it certainly does have to do with the line of fit. If the slope of the line is zero,...
Mathispower4u
Animation: A Line in y = mx + b Form
Animate a lesson with an animation. An explanatory video uses an animation to show viewers how adjusting the values of m and b in y = mx + b affects the graph of a line. Scholars see how modifying these parameters results in changes to...
Corbett Maths
Y=Mx+C
Slope-intercept form is key to understanding linear relationships. Learners explore the relationship between the equation, graph, and key features of linear functions as they view a video lesson. They then complete practice problems to...
Northeast Arkansas Education Cooperative
Recognizing When a Rational Expression is Undefined
It only takes the denominator to be zero to make an expression undefined. A video resource makes the connection of undefined fractions to rational expressions. It points out that to determine when a rational expression is undefined, you...
Curated OER
What is a Quadratic Function?
This is an introductory video on how to identify a quadratic function. This video explains what a quadratic function is and what the graph of a quadratic function looks like. The instructor goes through 4 examples of quadratic functions...
Curated OER
How to Find the Slope of a Line
Introduce your next math lesson with video that explains how to find the slope of a line through text and visuals. A brief definition and quick example are shown within the first 30 seconds. Note: There is no audio in this video.
Curated OER
Slope and Y-Intercept Intuition
The instructor uses a computer graphing program to illustrate how a line changes slope by manipulating the slope values in the equation. He also manipulates the y-intercept value to see where the line crosses the y-axis.
Curated OER
What Are Vertical Lines?
What does the graph of a vertical line look like? Well, it is a line that is straight up and down. What does the equation of a vertical line look like? So what kind of slope does a vertical line represent? Does the equation of a vertical...
National Education Association
Solve and Graph Simple Absolute Value Equations and Inequalities
What is the best method to overcome negativity? Remember your absolute value! An informative video starts with an explanation of what absolute value is and its connection to measurement. It goes on to solve sample problems to help...
Other popular searches
- Algebra Graphing Lines
- Graphing Lines Quilt Pattern
- Linear Equations and Graphing
- Linear Equations Graphing
- Pre Algebra Graphing Lines
- Area Graphing Lines
- Ged Graphing Lines


