Curated OER
Fast Food Survey Using Bar Graphs
Second graders conduct survey and sort data according to categories, construct bar graph with intervals of 1, and write a few sentences about their graphs.
Curated OER
Timed Multiplication Test Graphs
Learners use the tools of data analysis for managing information. They solve problems by generating, collecting, organizing, displaying histograms on bar graphs, circle graphs, line graphs, pictographs and charts. Students determine...
Curated OER
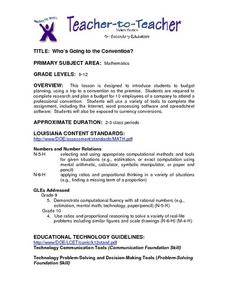
Who's Going to the Convention?
High schoolers practice planning budgets as they create a budget for ten employees of a company to attend a professional convention. They use the Internet, and spreadsheet software to complete their assignment.
Curated OER
Shapes are Everywhere
Second graders gain an understanding of geometric shapes and spatial reasoning. They learn the attributes of solid shapes in everyday activities. Students compare geometric shapes to everday objects, finding things that serve a purpose...
Other popular searches
- Medical Technology and Ethics
- Technology Ethics Netiquette
- Technology Ethics
- Technology Ethics Agreement


