Balanced Assessment
The Triskaidecaphobia Conference
Triskaidecaphobia is an extreme superstition to the number 13—and ironically the answer to the word problem is 13! Presented with a series of descriptive data, individuals analyze the data to determine the population size. They must...
Curated OER
Analyzing Country Data
Pupils analyze different data in percentage form. In this statistics lesson, students plot data using box-plots, dotplot, and histogram. They compare and contrast the collected data using the boxplot.
Curated OER
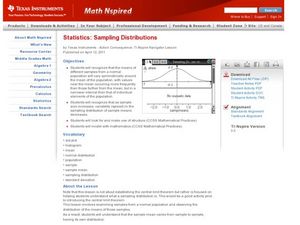
Sampling Distributions
Learners analyze sampling from different population. In this statistics lesson plan, students define the meaning of sample sizes and what causes an increase or decrease. They graph their data on the Ti calculator and draw conclusion from...
Curated OER
Assessing Normalcy
Students define normal distribution as it relates to the bell curve. In this statistics lesson, students use the central tendencies of mean, median and mode to solve problems. They plot their data and draw conclusion from the graphs.
Curated OER
What is a P-value?
Young scholars test the hypotheses using p values. In this statistics lesson, students define and examine conditional probability. They test each statement for a true statement or a false statement, based on the sample size.
Curated OER
Fantasy Baseball Team
Students create a database and use its ability to store, sort, and present information about their fantasy baseball team. They gather information and use their knowledge of statistics to accomplish their team.
Curated OER
How to Make Histograms
Students collect data and plot it using a histogram. In this statistics lesson plan, students interpret histograms. They find the frequency, percents and density.
Curated OER
Boxplots Introduction
Learners describe the pattern of a bell curve graph. In this statistics lesson, students move data around and make observation about the mean, and the quartiles. They define boxplot, outlier, range and other important vocabulary words...
Curated OER
Multiply Boxplots
Students identify the mean, quartiles and range of a boxplot. In this statistics instructional activity, students identify cooperative boxplot as it relates to the data. They make conjectures about students grade distribution.
Curated OER
Center and Spread
Young scholars collect and analyze data. In this statistics lesson, students define and calculate the range, median and standard deviation. They identify reasons for a skewed distribution.
Curated OER
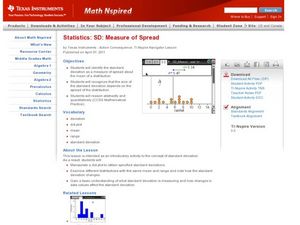
Measure of Spread
Students identify the standard deviation. In this statistics lesson, students find the mean distribution and calculate the percent of deviation from the mean. They observe this change on the Ti calculator.
Curated OER
How Far is Far?
Young scholars calculate the standard deviation of data. In this statistics lesson, students collect data, plot it and analyze it. They identify the mean, median and range of their data.
Curated OER
Center of Mass
Students identify the geometric mean of their data. In this statistics lesson, students collect data and graph their findings. They identify the mean, range and mode.
Curated OER
Z-Scores
Learners solve problems by identifying the percent of area under the curve. In this statistics lesson, students discuss z-scores as they calculate the different percentages under the bell curve. They calculate the standard deviation.
Curated OER
Normal Probability Plot
Young scholars analyze the graph of a distribution. In this statistics lesson, students define skewed or mound shape distribution as they investigate the data behind the graph. They define and plot outlier as well as normal probability.
Curated OER
Looking Normal
Students identify the shape of a function. In this statistics lesson, students plot the data collected. They analyze their data for positive, negative or no correlation. They find the line of best fit.
Curated OER
Percentiles
Students analyze the bell curve and make predictions. In this statistics instructional activity, students calculate the percentile to the left of the curve. They then are given the percentile and create the graph from the data.
Curated OER
Probability Distributions
Students collect and plot data on a graph. In this statistics instructional activity, students analyze the distribution of a sample and predict the outcome. They find the line of best fit and discuss what would make the sample larger.
Curated OER
Why Divide by N-1?
Learners identify the mean and variance. In this statistics activity, students calculate the population variance using the N as a divisor. They draw the relationship of dividing by N and N-1.
Curated OER
Confidence Levels
Young scholars collect data and graph it. In this statistics lesson, students rate confidence levels by collecting data and analyzing it. They graph their findings on the Ti calculator.
Curated OER
Meaning of Power
Students graph exponential and power functions. In this statistics lesson plan, students test a specific hypotheses and draw conclusion. They use the graph of polynomials to test and draw their conclusions.
Curated OER
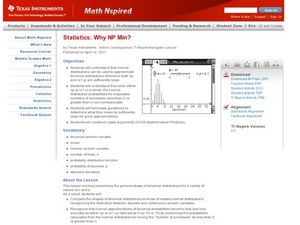
Why NP Min?
Students calculate the normal distribution. In this statistics lesson plan, students use the normal distribution to estimate binomial distributions. They define when to use NP and n(1-p) to make approximations.
Curated OER
Shut it Off!
Students identify the central tendencies. In this statistics lesson, students find the mean, median and mode of their collected data. They explain the effect of outliers on the data.
Curated OER
Analyzing Graphs and Data
Students collect and analyze data. In this statistics lesson, students graph their data and make inferences from the collected data. They display their data using graphs, bar graphs, circles graphs and Venn diagrams.


