Grammarly
Grammarly Handbook: Visuals: Graphs, Charts, and Diagrams
This article explains that graphs, charts, and diagrams are used to display information visually. The choice of what type of graph or chart to use depends on the information to be displayed. Software programs make these much easier to...
Purple Math
Purplemath: Graphing Linear Equations: T Charts
A nice tutorial on how to graph linear equations. Goes through the process step by step and gives numerous examples.
Other
Delta State University: Lesson Plan 3: Pie Graphs
The students will gather, organize, and display data in an appropriate pie (circle) graph using M&M's! [PDF]
Math Planet
Math Planet: Pre Algebra: Circle Graphs
Learn about circle graphs or pie charts through examples and a video lesson.
Texas A&M University
Wtamu Virtual Math Lab: Beginning Algebra: Reading Graphs
A good introduction to reading bar, line, and double line graphs, and drawing and reading Venn diagrams. Contains definitions and examples of these types of charts and graphs as well as practice exercises that ask you to answer questions...
Better Lesson
Better Lesson: Circle Graph Activity
This lesson plan will allow the student to work through three stations. The stations will focus on creating and analyzing circle graphs. The students will be using technology to create their graphs along with a hands on activity using M...
Illustrative Mathematics
Illustrative Mathematics: Color Week
Five-year-olds need to count things that relate to them. This activity builds on their need to be included or see the relevance of their counting. Students will practice counting, writing numbers, and filling in a chart or bar graph....
Council for Economic Education
Econ Ed Link: The Economics of Homebuying
This lesson analyzes the costs and benefits of homeownership and asks the student to describe the factors that affect affordability, use cost-benefit analysis and knowledge of home-buying procedures to reduce the costs, analyze the...
abcteach
Abcteach: Solar System Links
[Free Registration/Login Required] This resource provides several links to elementary information about the Solar System. Students and teachers will find charts, graphs, crossword puzzles, word searches, report forms and more.
PBS
Pbs: The Lowdown: u.s. Gun Homicides: Visualizing the Numbers
Explore firearm deaths in the United States in 2010 by type, race, and age group in this interactive from KQED. In the accompanying classroom activity, students are presented with a simple question: Is America a safe place to live? In...
Council for Economic Education
Econ Ed Link: Demand Shifters
Check out this informative economics lesson plan that teaches about demand, and factors that cause demand for a good or service to change. Learners learn to recognize factors that influence one's behavior as a consumer.
The Math League
The Math League: Ratio and Proportion
This tutorial provides definitions and examples of ratios and proportions and features comparing ratios and converting rates.
English Zone
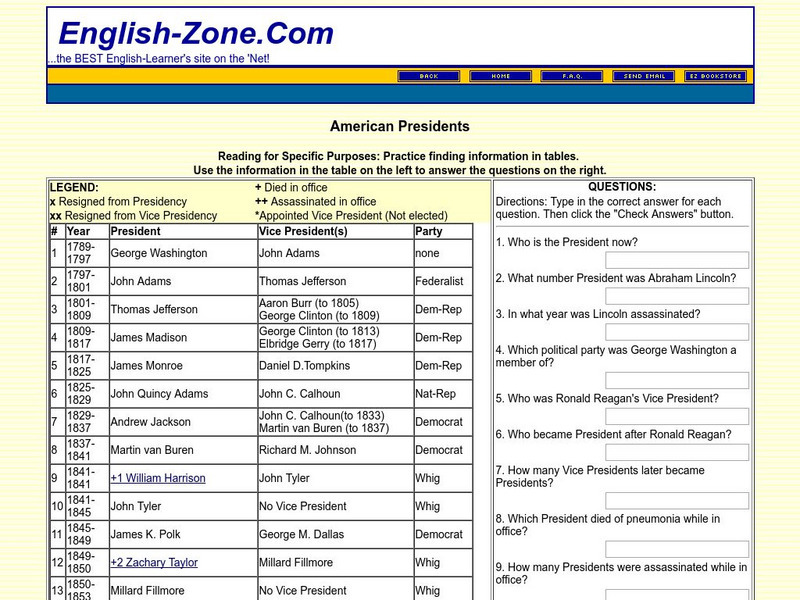
English Zone: American Presidents: Reading for a Specific Purpose
In this activity, information about American presidents is provided in chart format on the left and asks students to use the chart to answer the questions on the right. Note: the last president listed is George W. Bush. Java is required.
Other popular searches
- Pie Charts and Graphs
- Reading Charts and Graphs
- Behavior Charts and Graphs
- Charts and Graphs Candy
- Interpret Charts and Graphs
- Charts and Graphs Christmas
- Charts and Graphs Math
- Analyzing Charts and Graphs
- Tables, Charts and Graphs
- Charts and Graphs Europe
- Using Charts and Graphs
- Bar Graphs and Charts


