Texas Education Agency
Texas Gateway: Informational Text: Synthesize Information in Charts and Graphs
In this lesson, you will learn how to understand the data found in charts and graphs, and at the end of the lesson, you will practice what you have learned.
Texas Education Agency
Texas Gateway: Synthesize Information in Charts and Graphs (English Ii Reading)
Synthesize information that you find in charts and graphs.
Quia
Quia: Reading Charts and Graphs Quiz
This 25-question quiz asks students to read various kinds of charts and graphs and to select the correct answers to the questions. Immediate feedback is provided after each question. Java is required.
Texas Education Agency
Texas Gateway: Synthesize Information in Charts and Graphs (English Ii Reading)
Synthesize information that you find in charts and graphs.
Education Development Center
Tune in to Learning: Reading Charts and Graphs
Practice graph reading skills with these exercises and companion tutorials.
National Center for Ecological Analysis and Synthesis, University of California Santa Barbara
Ucsb / Pie Graphs (Piece of Cake)
This page gives an example and easy-to-understand description of a pie graph (circle graph.) Also provides an opportunity for students to test their abilities to read a pie graph.
Texas Education Agency
Texas Gateway: Evaluating Data in Tables, Graphs and Charts
[Accessible by TX Educators. Free Registration/Login Required] In this lesson students look at examples of graphics, tables, charts, and graphs, and learn how to interpret their data. They will be able to use this skill to enhance their...
National Center for Ecological Analysis and Synthesis, University of California Santa Barbara
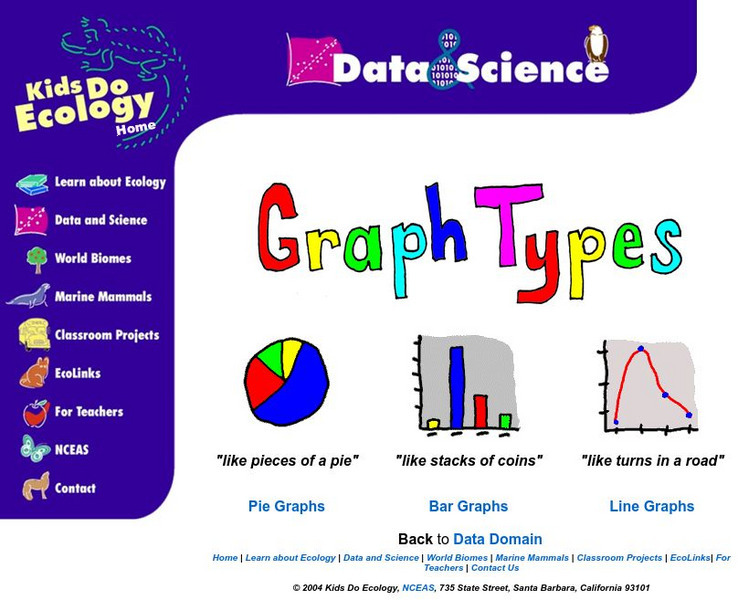
Nceas: Graph Types
At this site from NCEAS you can learn how to organize your data into pie graphs, bar graphs, and line graphs. Explanations and examples are given of each graph along with several questions that check comprehension.
US Department of Education
Nces: Create a Graph: Kids Zone
Make your own pie, bar, line, area or XY graph with this interactive tool. Look for examples of graphs already created from data collected by the National Center for Education Statistics. Complete with a graphing tutorial.
E-learning for Kids
E Learning for Kids: Math: Group of Pyramids: Fractions and Graphs
On this interactive website, students practice various math skills using a real-life scenario at the pyramids. Those skills include showing percentages as fractions and decimals and interpreting data in a sector graph.
McGraw Hill
Glencoe: Self Check Quizzes 2 Circle Graphs
Use Glencoe's Math Course 2 randomly generated self-checking quiz to test your knowledge of circle graphs. Each question has a "Hint" link to help. Choose the correct answer for each problem. At the bottom of the page click the "Check...
Beacon Learning Center
Beacon Learning Center: Interpreting Line Graphs
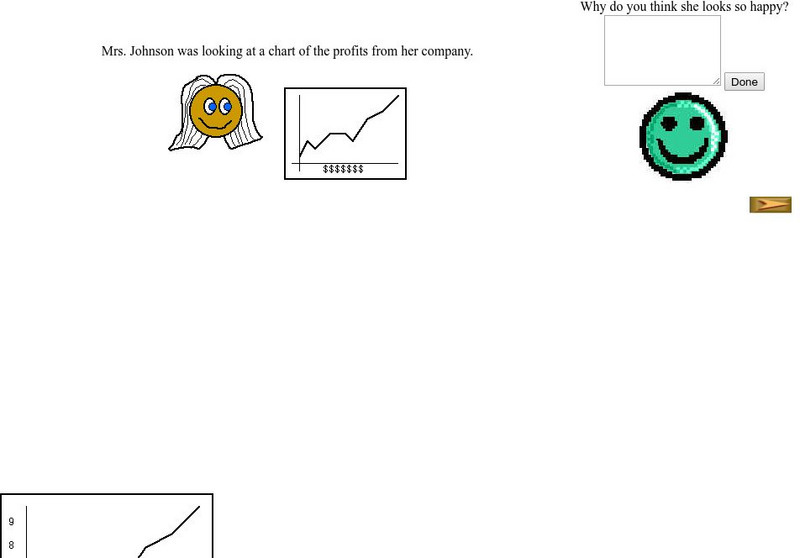
This site is a lesson on creating and interpreting a line graph. It explains how a line graph is created and then asks questions about what is learned from the data. Students type in open responses, and answers and feedback follow.
Other
Hubspot: Data Visualization 101: How to Design Charts and Graphs
Your data is only as good as your ability to understand and communicate it, which is why choosing the right visualization is essential. Learn more in this guide.
US Department of Education
Nces Kids: Creating an Area Graph
This is where you will find step by step directions explaining how to create an area graph. Complete each step and click on the next tab. Directions are simple and clear.
Texas Education Agency
Texas Gateway: Analyze Graphical Sources: Practice 2 (English I Reading)
This lesson focuses on practice exercises to understand and interpret the data in a graphic representations including pie charts, bar graphs, and line graphs.
Colorado State University
Colorado State Writing Center: Charts
The use of charts and graphs can improve your presentations, whether on paper or as visual aids. Here you can read about how to create line, column, bar, pie graphs, and scatterplots. Just follow the links to their respective pages.
CK-12 Foundation
Ck 12: Statistics: Pie Charts Grade 6
[Free Registration/Login may be required to access all resource tools.] Interpret circle graphs and make predictions based on the displayed data.
Sophia Learning
Sophia: Types of Graphs
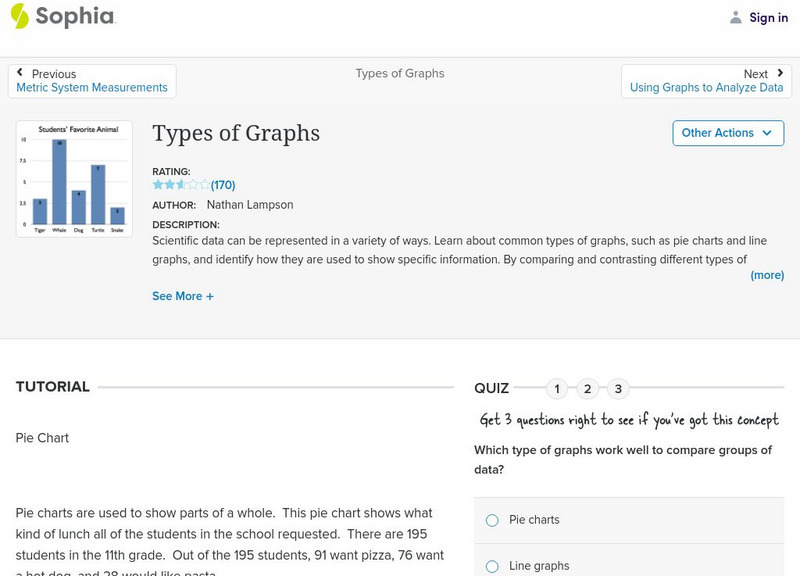
This presentation allows the learner to visualize the different types of graphs used to display data in scientific investigations.
E-learning for Kids
E Learning for Kids: Math: Movie Theater: Circle Graphs
On this interactive website, students practice interpreting information in circle graphs.
Varsity Tutors
Varsity Tutors: Hotmath: Algebra Review: Circle Graph
Find a quick, concise explanation of Circle/Pie Graphs. An example is given and step by step clearly explained.
Shodor Education Foundation
Shodor Interactivate: Circle Graph
This site shows how to set up your own pie chart for papers and projects. Very colorful and it is free.
Beacon Learning Center
Beacon Learning Center: Kinds of Graphs
An interactive web lesson introduces five types of graphs to students and allows them to practice matching the names to examples.
ClassFlow
Class Flow: Charts Handling Data
[Free Registration/Login Required] Reading graphs fit together with this engaging, colorful flipchart analyzing pie charts, bar graph, percents, and fractions.
Other
Online Statistics Education: Graphing Distributions [Pdf]
This is the second chapter of a statistics e-text developed collaboratively by Rice University, University of Houston Clear Lake, and Tufts University. It looks at many different types of data displays and the advantages and...
Other popular searches
- Pie Charts and Graphs
- Reading Charts and Graphs
- Behavior Charts and Graphs
- Charts and Graphs Candy
- Interpret Charts and Graphs
- Charts and Graphs Christmas
- Charts and Graphs Math
- Analyzing Charts and Graphs
- Tables, Charts and Graphs
- Charts and Graphs Europe
- Using Charts and Graphs
- Bar Graphs and Charts

